The US equity market has dramatically recovered from the depths of the bear market reached in June this year. As of yesterday, the S&P 500 is down just over 10%. Despite the amazing run in recent weeks, not many investors are convinced that the bear is dead for a variety of reasons. Irrational exuberance by investors on some weak reading of inflation figures for last month is the main driving force behind the run up. The following are just a handful of factors that are indicative of a bear market than a bull market:
- Though oil prices are falling they are still high.
- Inflation is still high in many areas especially in groceries.
- The Russia-Ukraine war is still on. The war that was to be the trigger for WW III is not over almost overnight with Russia defeated.
- The proverbial throwing of the towel and avoid stocks like the plague has not happened yet. Investors are still excited with market movements and past manias such as the one with meme stocks is still on.
- Pandemic excesses have not dissipated in many sectors of the market.
With that brief over the below chart from BT shows the bull and bear markets in the S&P 500 from 1940 thru June, 2022:
Click to enlarge
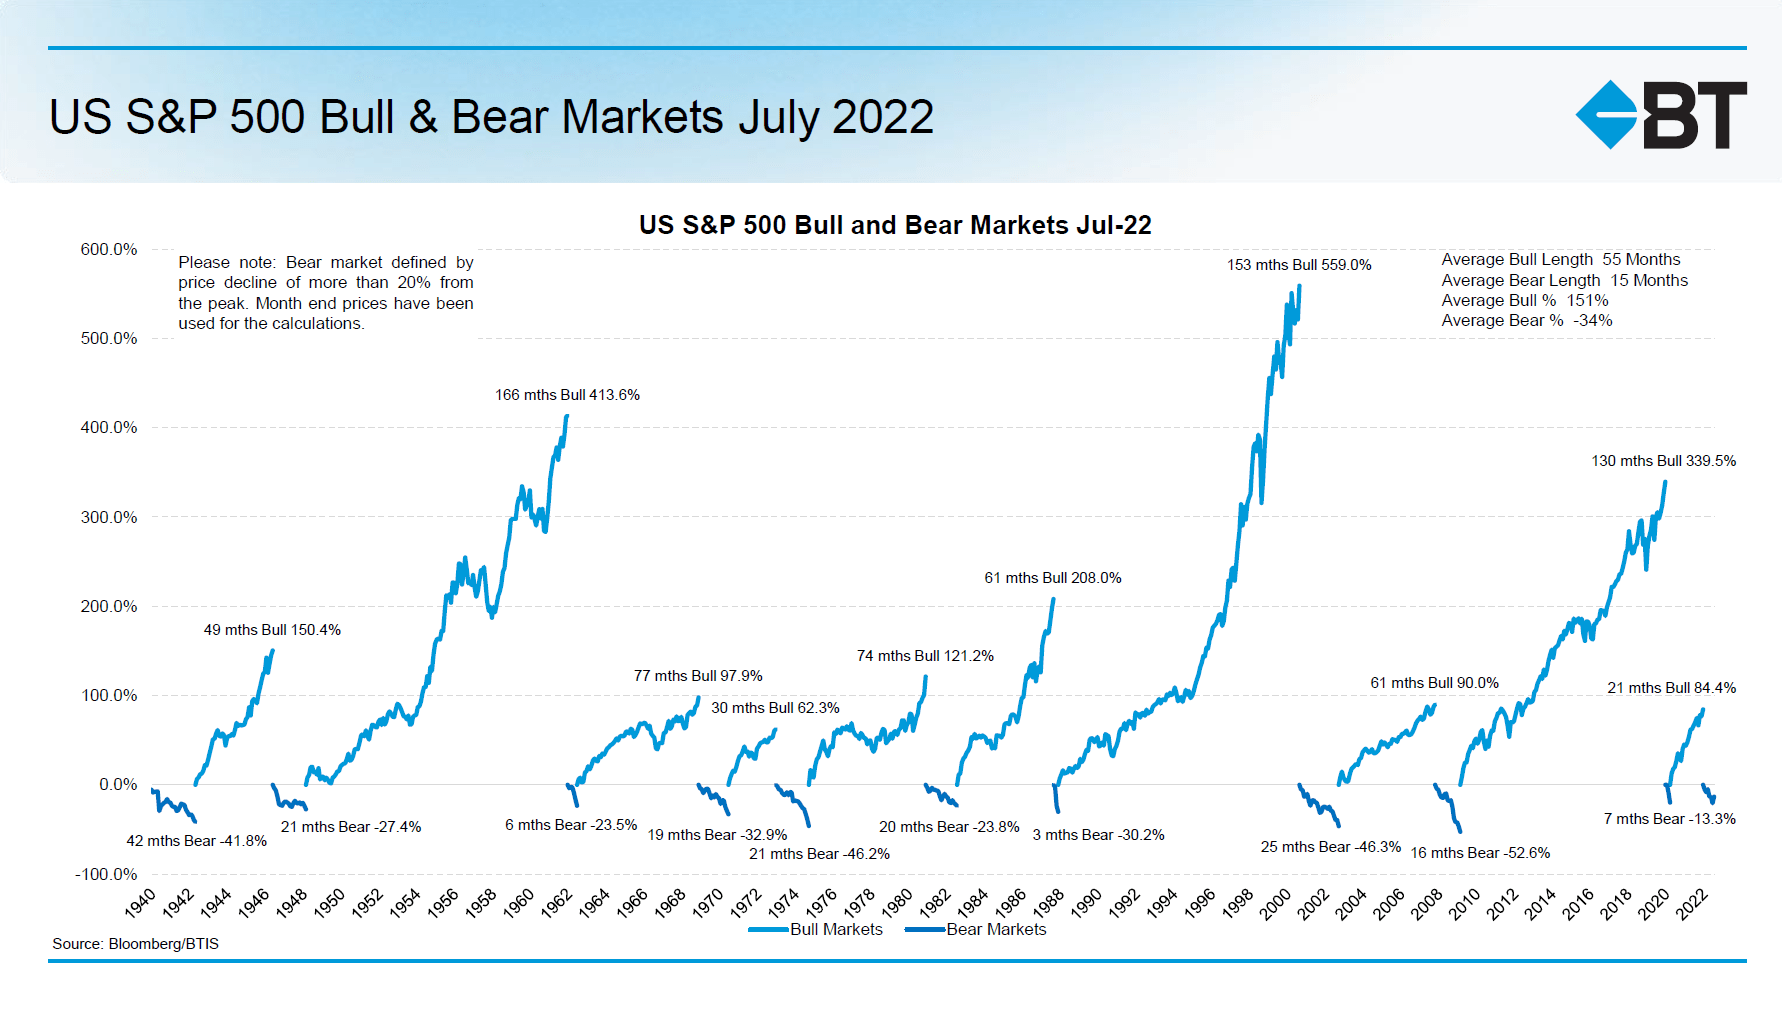
Source: Market Insights, Bull and Bear, July 2022, BT
Related ETF:
- SPDR S&P 500 ETF Trust (SPY)
Disclosure: No Positions


