The Top 10 Global Companies in Renewable Energy Projects between 2015 and 2022

The Renewable Energy is one of the fast growing industries in the world. As many countries try to move away from fossil fuels and raise their green industry credentials, they are allocating more funds to drive growth. Until last year renewable industry was hot and as a result investors were bidding up renewable stocks. This year though renewables have lost their momentum and many companies have seen their stock decline heavily from recent highs.

Renewable energy is here to stay and hence long-term investors should not write-off these companies. Current downturn in the sector might seem like a great time to pick shares on the cheap years from now. With that said, which firms are the top players globally in this industry?

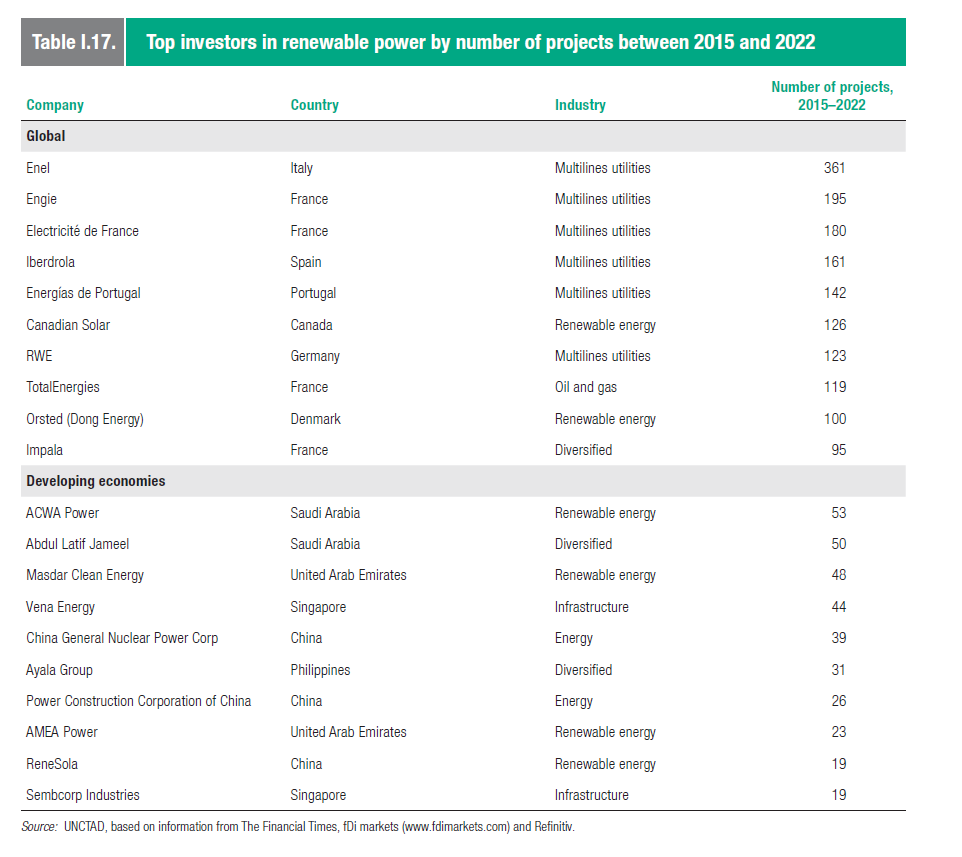
The following table from UN’s World Investment Report | UNCTAD shows the top 10 companies in terms of renewable project investment from 2015 to 2022:

Click to enlarge

Source: World Investment Report 2023, UNCTAD

Italy’s Enel(ENLAY) tops the ranking followed by Engie(ENGIY) and Electricitie de France (ECIFY) of France. European firms dominate this list with the exception of Canadian Solar of Canada. Interestingly oil and gas major Total’s TotalEnergies (TTE) appears in this list.

For investors looking to explore investment opportunities in this space, the above list is a good starting point for further research.

Some of the major domestic players in renewable energy are:

  • NextEra Energy Inc (NEE)
  • Duke Energy Corp (DUK)
  • AES Corp (AES)

Disclosure: Long RWEOY of RWE, Germany and NEE
Real Property Taxes in Europe: Chart

Property taxes in modern times are taxes levied on both the land and the real property it sits on. Both of these fluctuate on an yearly basis in the US and accordingly the taxes due. Since the Covid-19 pandemic the boom in residential property prices across the country has been a windfall for local governments as they are able to generate more revenues in property for the same property.

Property taxes in Europe vary between countries sometimes significantly. According to an article by Alex Mengden at the Tax Foundation, property taxes are not levied by Liechtenstein and Malta. Estonia collects tax only on the land. Luxembourg has the lowest property revenue as a share of its private capital stock at 0.05% followed by Switzerland and the Czech Republic. The highest property taxes are in the UK followed by Iceland and Greece.

The following chart shows the real property taxes in Europe based on 2021 data:

Click to enlarge

Source: Real Property Taxes in Europe, Tax Foundation

The Ten Largest Companies in the S&P 500 from 1980 to 2020: Chart

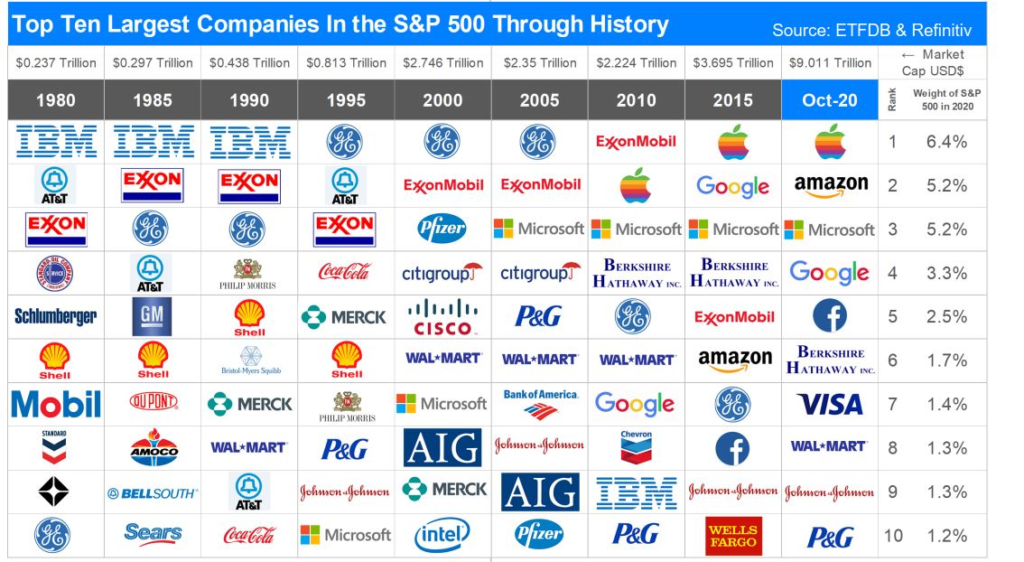
One of the main strategy for success with investing in equity markets is diversification. Companies tend to rise to the top based on the theme that is hot during a specific period. Once at the top no company stays there forever. Leadership in the S&P 500 changes on a regular basis. One time it may be the tech sector that is hot while another time it may be the good old oil or some other sector. So the important point to remember is today’s leaders could become tomorrow’s losers and vice versa. The following chart shows this concept with the leadership changes in the S&P 500 from 1980 to 2020:

Click to enlarge

Source: Lessons From Market History: Price Does Matter, Pacifica Partners

Tech giant IBM (IBM) used to be a market darling during the 80s and early 90s. That is no longer the case. IBM nowadays is just another also-run company that is still living off its former glory. Similarly who could forget about that great American wonder called the GE(GE). After a spectacular collapse the company is basically today nothing that made GE the GE. Its appliance business was taken over some Chinese firm and GE also exists but barely. Oil major ExxonMobil(XOM) appearing in this list for many years shows the importance of oil for the US economy.

The key takeaway from this post is that today’s hot stocks like Tesla(TSLA), Nvidia(NVDA), Facebook(FB), etc. could easily turn out to be duds in the years to come.

Disclosure: No positions

Germany’s DAX Index Returns Triangle 1953 to 2021: Chart

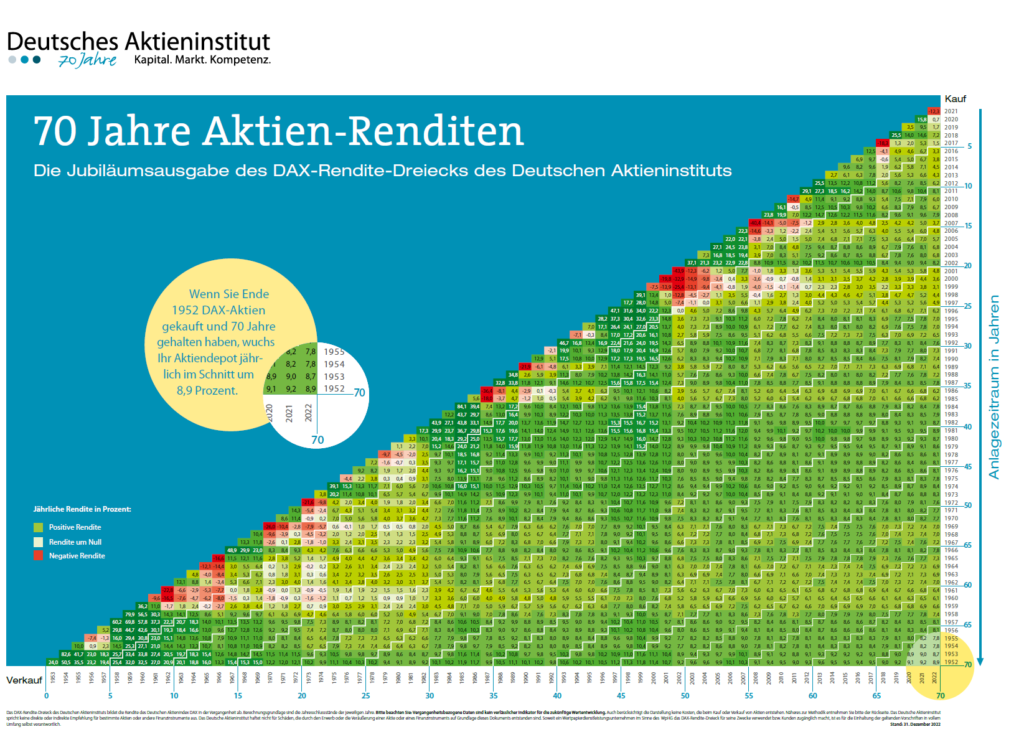
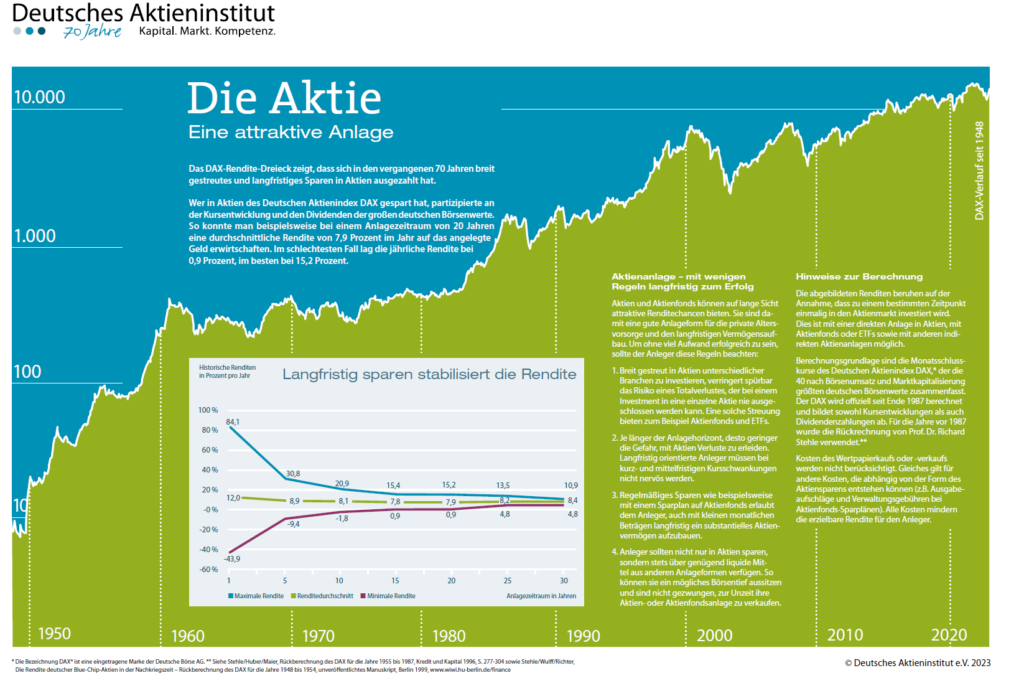
The German Stock Institute published their updated version of the DAX Index Annual Returns Triangle Chart for the years from 1953 to 2021. According to this chart, the average annual return on the DAX return over the past 70 years thru 2021 was 8.9%. For the most chart the chart shows positive returns in any given period.

Click to enlarge

Note: Use Google Translate since the text in the chart above is in German

Source: German Equity Institute 

Related ETF:

  • iShares MSCI Germany Index Fund (EWG)

Disclosure: No Positions

Always Focus on the Market’s Long-Term Performance: S&P 500 Example

Equity markets always go through periods of booms and busts. During bull markets, stocks can earn astonishing returns and of course when markets turn the other way losses can be shocking. Sometimes the volatility on both ways can be gut wrenching. For stock investors the key attribute for success is to side out the volatility and focus on the long term goal. Simply getting worried about day-to-day movements of the market is not useful.

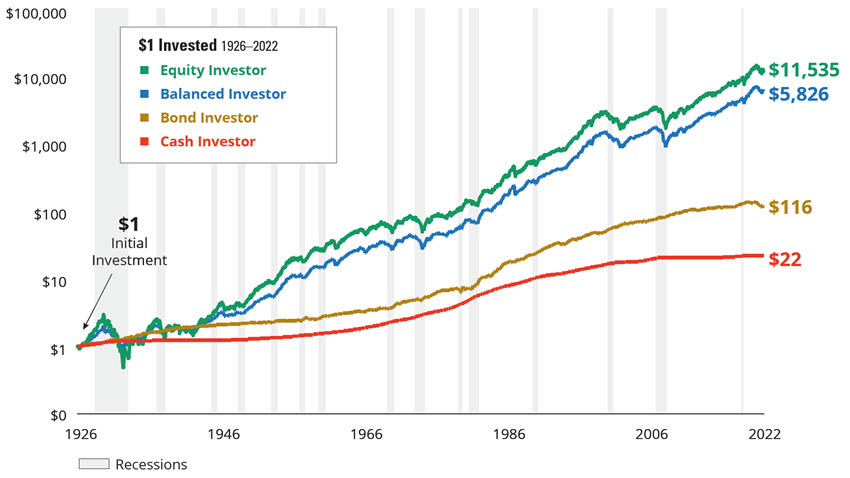
With that said, the following charts the performance of four investments over the long term from 1926 to 2022:

Click to enlarge

Source: It’s Easy to Forget the Market’s Good Years, Hartford Funds

The chart shows the stocks earned the best returns and cash was the worst performer. Bonds also fared poorly relative to stocks.

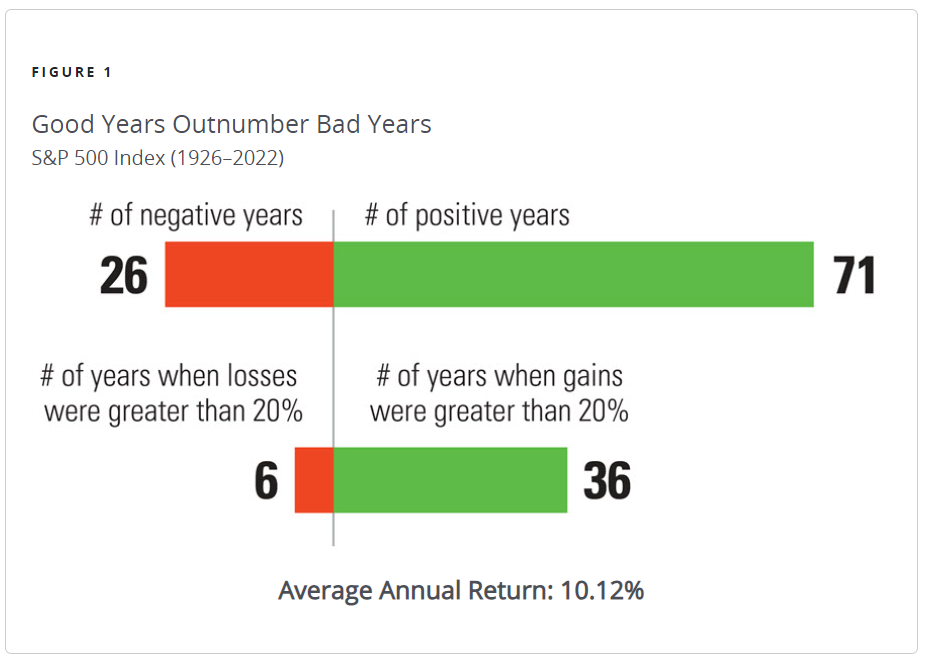
Another important point to remember is that over many years the number years with positive returns are higher than the number of years with negative returns. So by holding stocks for the long run, investors can generate a decent return.

Click to enlarge

Source: It’s Easy to Forget the Market’s Good Years, Hartford Funds

Related ETFs:

  • SPDR S&P 500 ETF (SPY)
  • Vanguard S&P 500 ETF (VOO)

Disclosure: No positions