Stocks are the best asset class to own to build wealth over the long-term. I have posted many charts on how stocks recover after bear markets and that number of year of bull markets tend to outnumber the number of bear market years. Recently I came a chart showing the bull and bear markets in the Canadian equity market. As with other major developed markets, Canadian stocks have also generated double digit total returns during bull markets. Moreover they have recovered after bear markets as well. The chart shows the bull and bear markets in Canadian stocks from the 1930s to 2022:
Click to enlarge
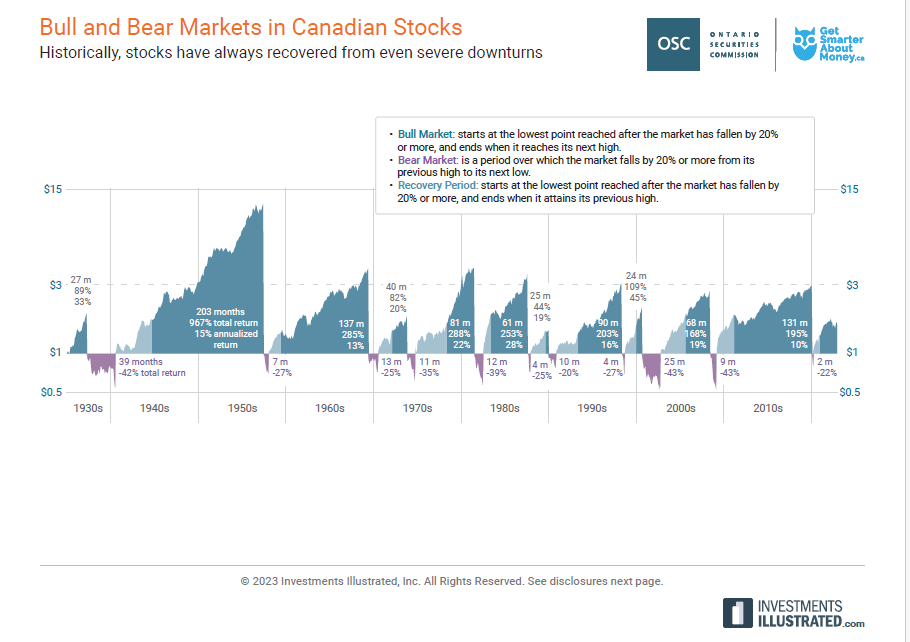
Source: Get Smarter About Your Money, Ontario Securities Commission