On the Sector Breakdown of India’s S&P BSE SENSEX Index

The S&P BSE SENSEX is the benchmark index of the Indian equity market. The index is up around 9% so far this year. In this post, let’s take a quick look at the sector composition of Sensex.

According to S&P, the Sensex “is designed to measure the performance of the 30 largest, most liquid and financially sound companies across key sectors of the Indian economy that are listed at BSE Ltd.”. The index was launched on Jan 1, 1986.

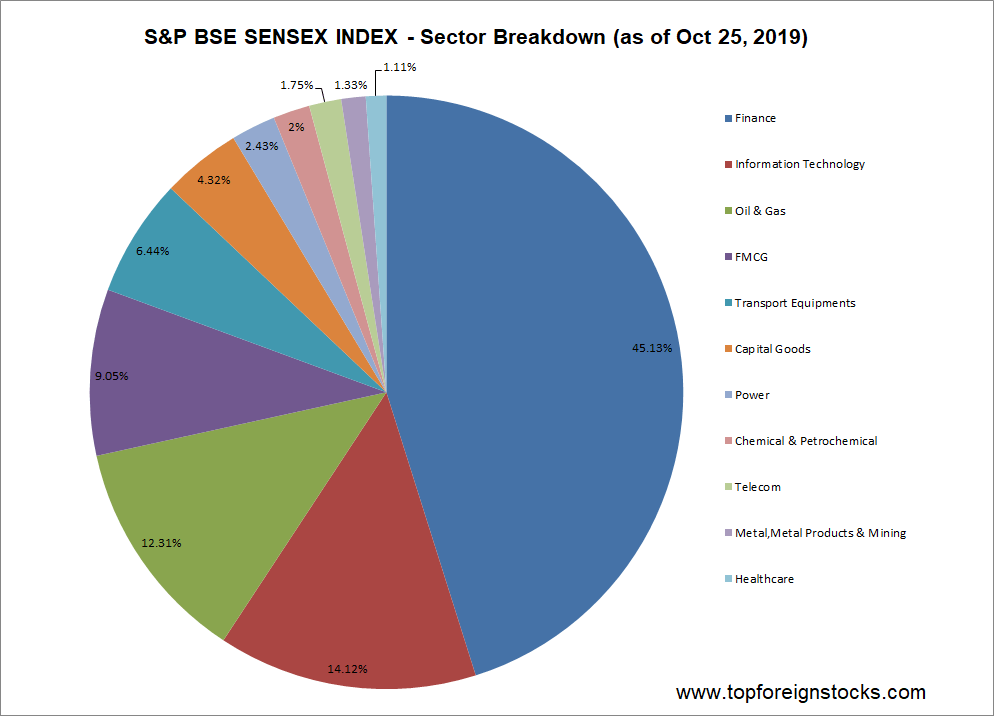
From a sector composition standpoint, the Sensex is highly concentrated with Finance accounting for 45% of the index. Though finance/banking traditionally is a major sector in emerging market indices, having a nearly 50% weightage is unusual even for an emerging market. The dominance of one sector at such levels is not a sign of a healthy market. Any disruption in the sector or collapse in banking stocks would have a dramatic influence on the direction of the index.

The following chart shows the sector breakdown of the S&P BSE SENSEX Index:

Click to enlarge
Source: BSE

The other major sectors by weight are Information Technology, Oil & Gas and FMCG (Fast-Moving Consumer Goods). Though India is a major software exporter, IT accounts for just 14%. Healthcare is hardly a significant sector in the Indian equity market as represented by the 1% allocation in the Sensex.

Download: Factsheet – S&P BSE SENSEX Index

Related ETF on the US market:

  • PowerShares India ETF (PIN)
  • The iShares MSCI India ETF  (INDA)

Disclosure: No Positions

Also checkout: The complete list of Indian ADRs trading on the US markets
The Global Auto Industry is an Oligopoly

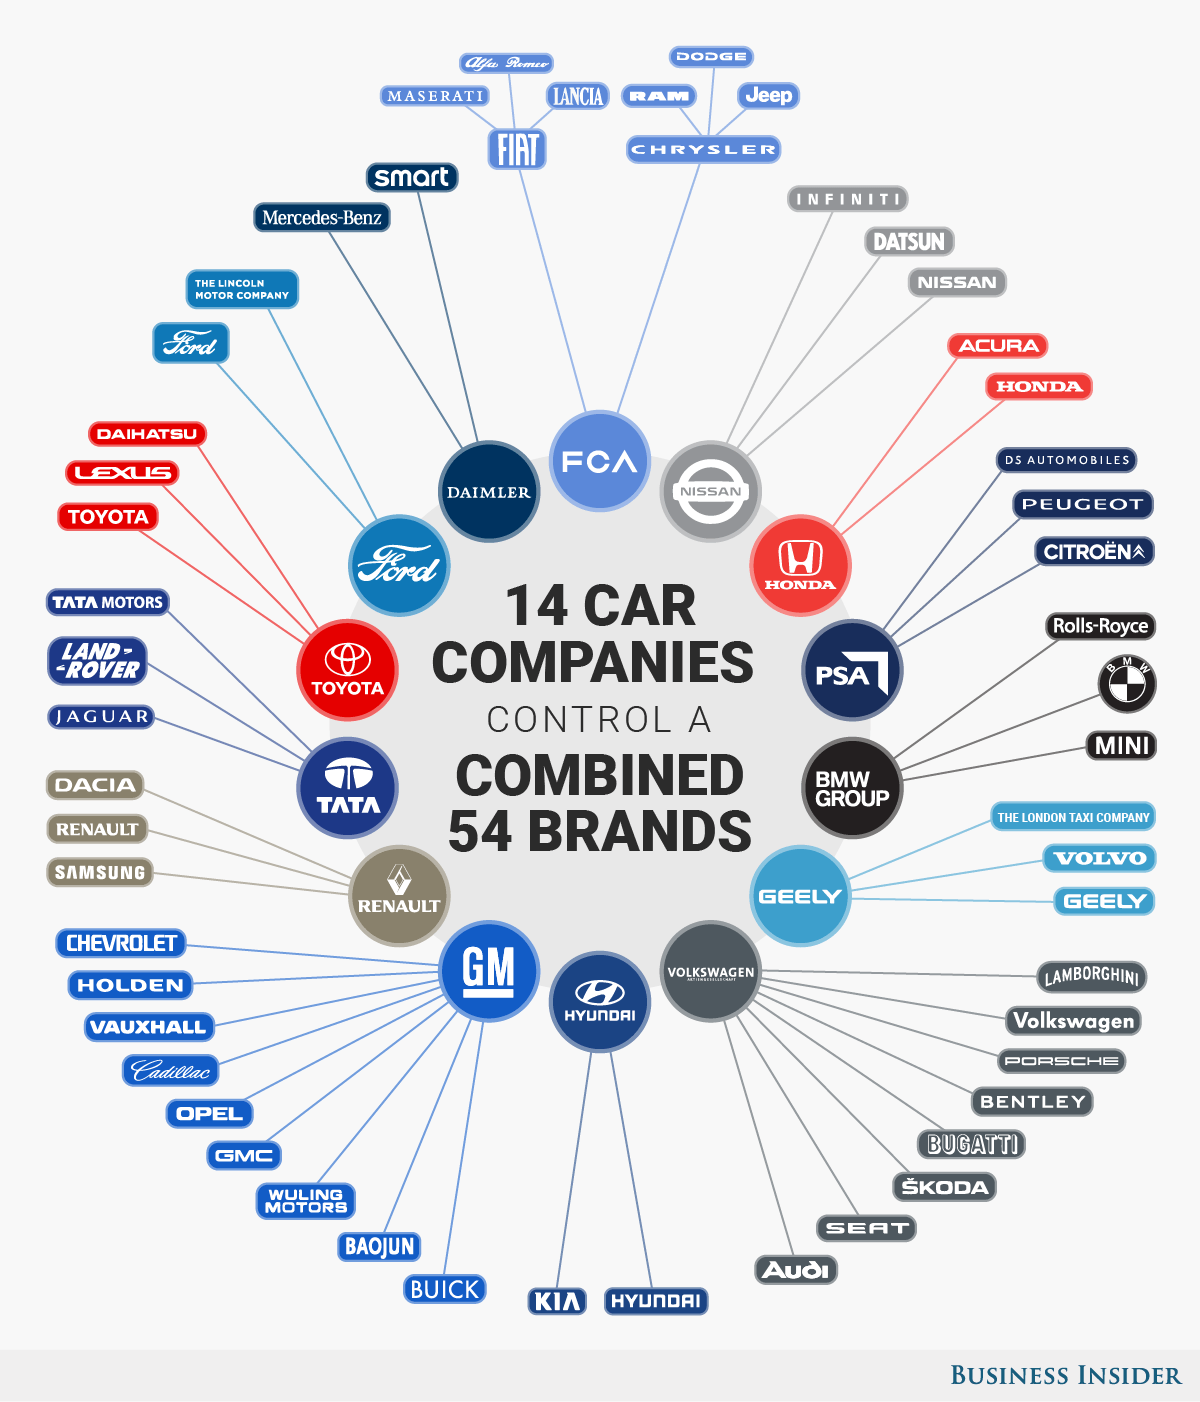
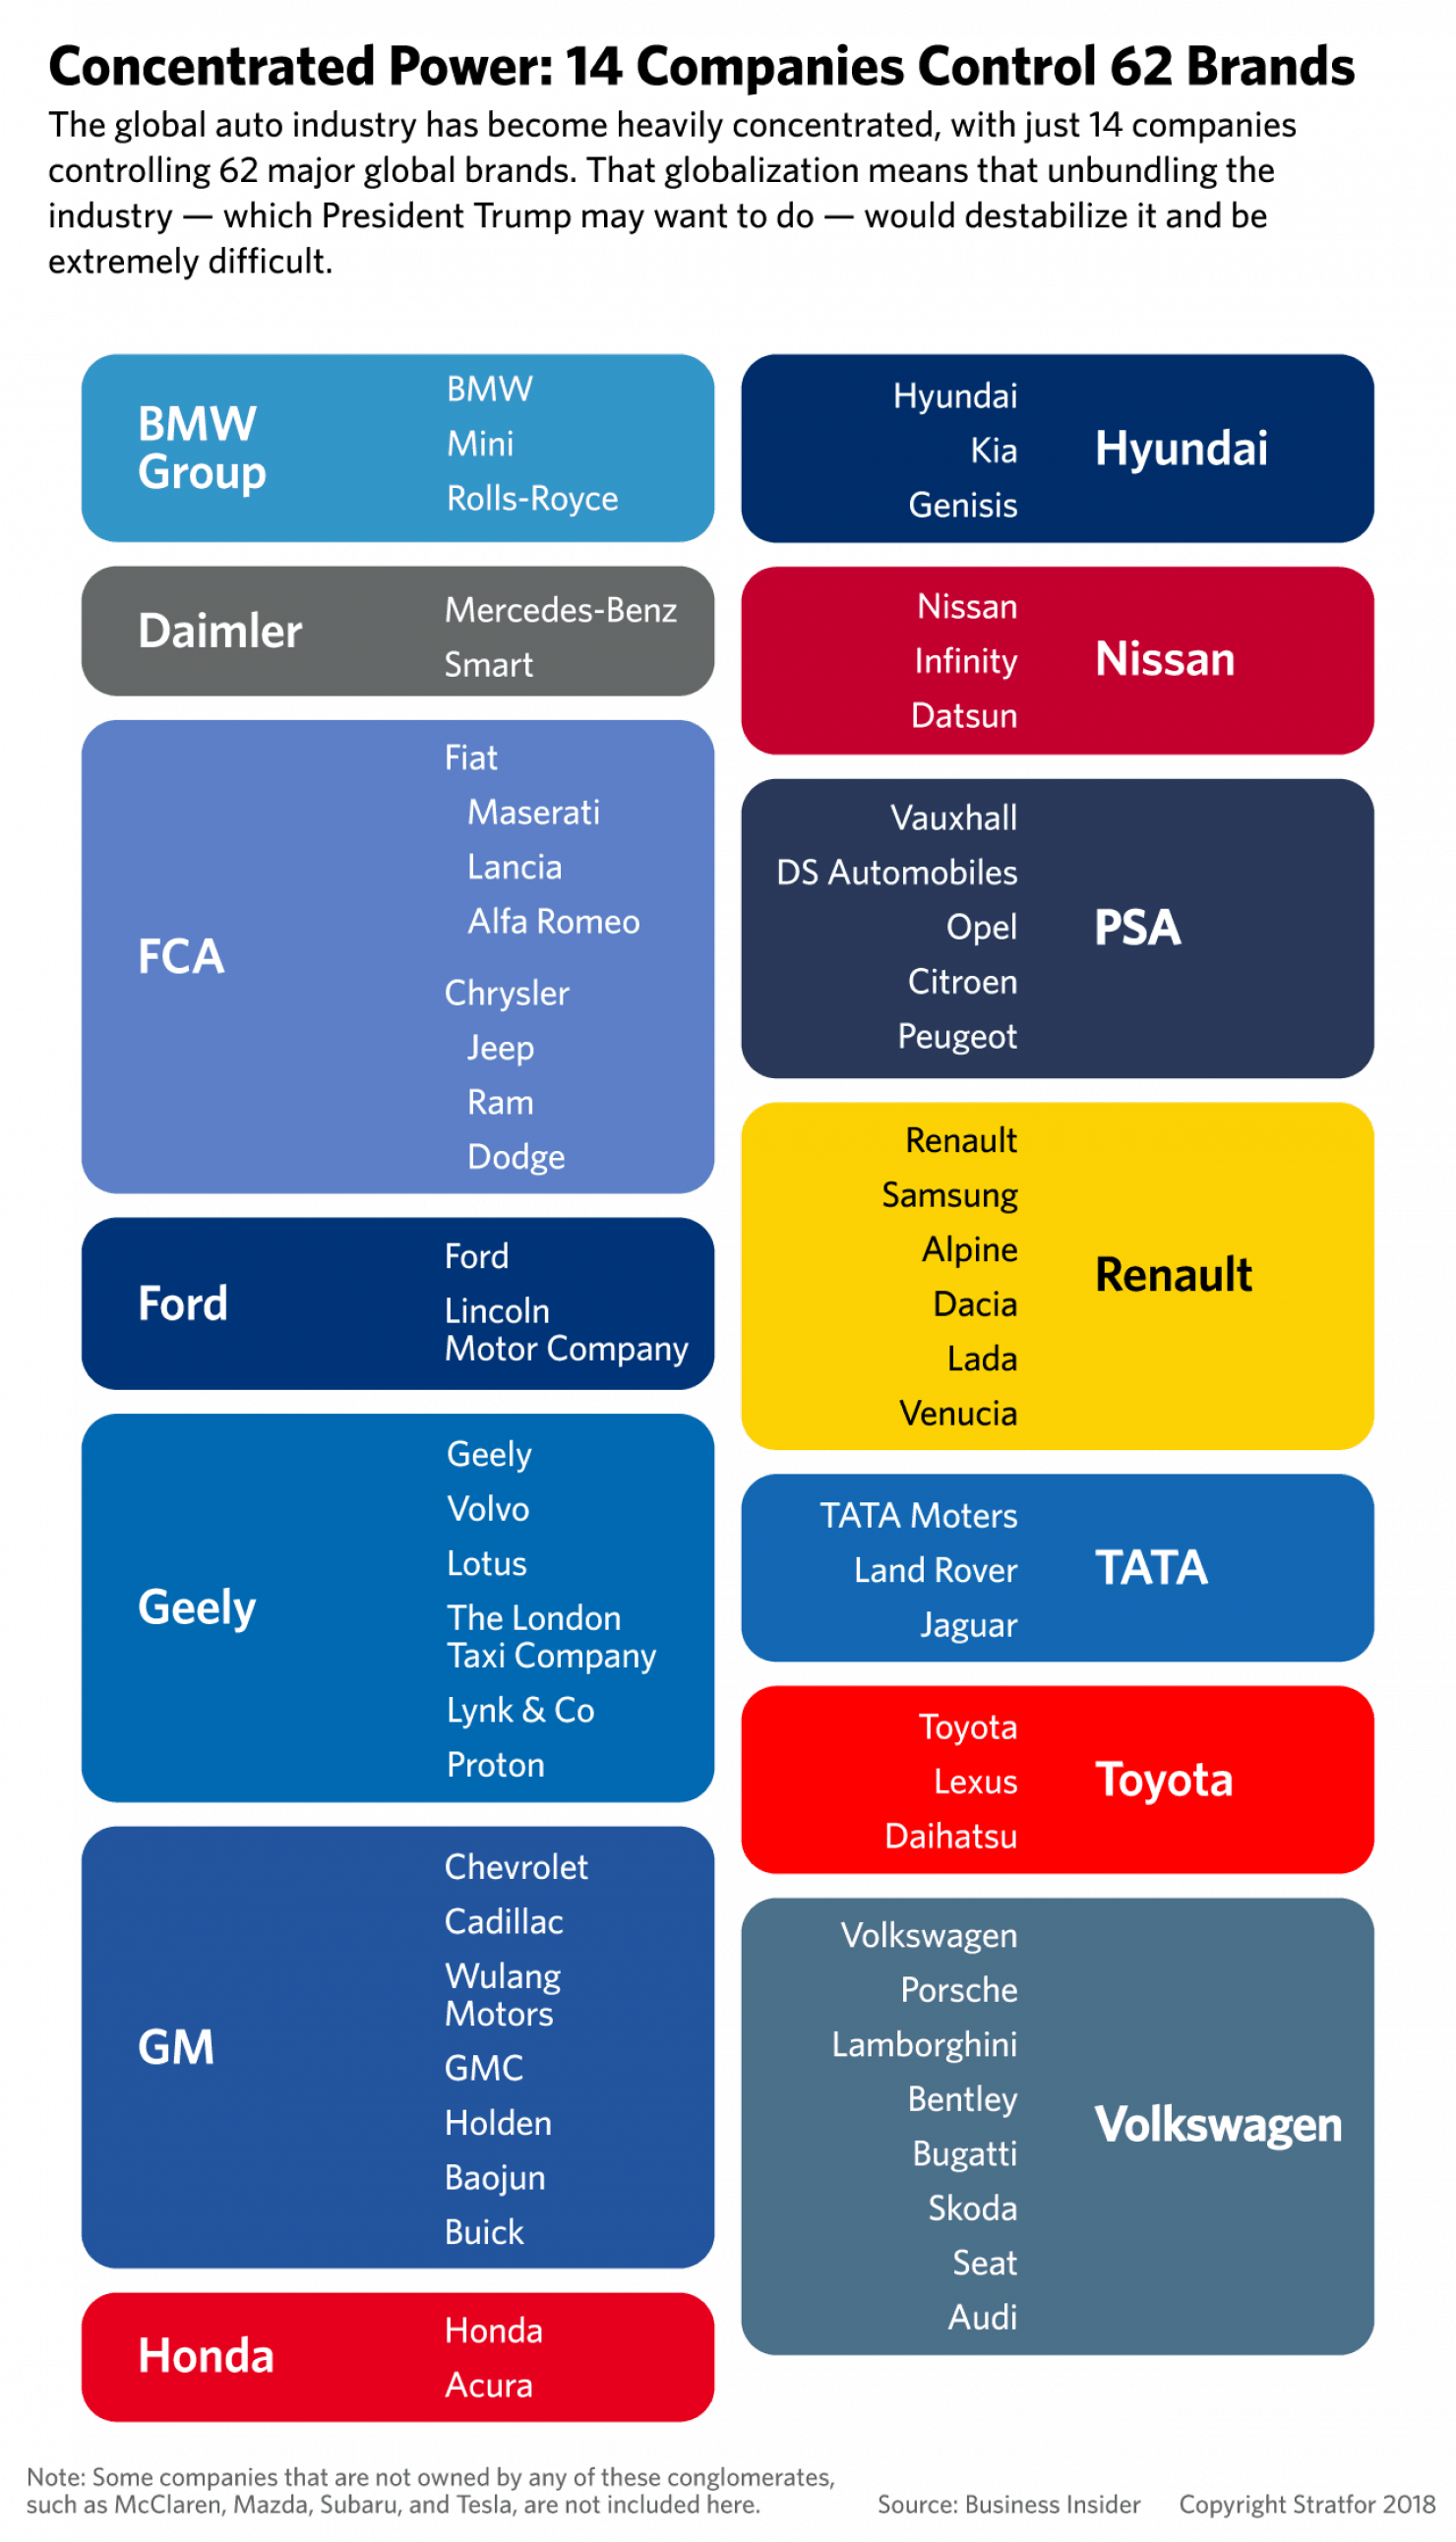
The global automobile industry is not a highly competitive industry with thousands of players. Instead just like in other major industries, the auto industry is an oligopoly where a handful of firms dominate the market. Small companies trying to enter and compete against the giants is mostly impossible. For example, in the US the market is concentrated with just three companies – Ford(F), General Motors(GM) and Chrysler, which is now Fiat Chrysler Automobiles N.V.(FCAU) after the merger of Fiat and Chrysler in 2014.

Globally 14 firms control 62 brands as shown in the chart below. Most consumers may not be aware the same company owns multiple brands.

Click to enlarge

Source: Why Hitting the Gas on Car Tariffs Could Stall Everyone, Startfor

Updated – 12/6/20:

1.Fourteen Firms Dominate the Global Auto Market:

Click to enlarge

Source: Visual Capitalist

You may also like:

The Six Biggest Bull Markets Since 1962 and Their Subsequent Bear Markets: Chart

The current bull market in US stocks can be called as “The Most Hated Bull Market” in history. This is because unlike any other bull market, this bull does not have the feel to it. For example, there is nothing like the craze and euphoria that swept the country during the dot com mania of the late 90s. Even though today the NASDAQ is up over 23% year-to-date and has had an astonishing run since the trough of the Global Financial Crisis(GFC) of 2008-09, there is not much investor participation and moreover a handful of tech titans( FAANGs for instance)are powering the index to ever greater highs. Similarly, the S&P 500 has increased by over 20% on price terms alone YTD. Still the usual thrill of a bull market is not there.

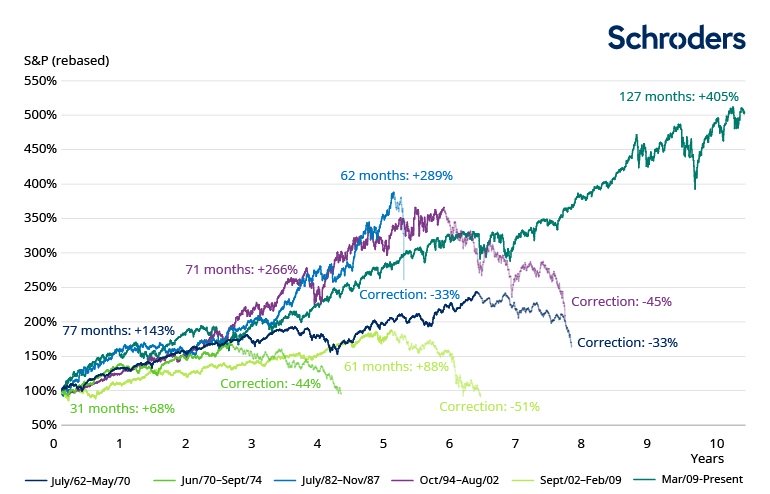
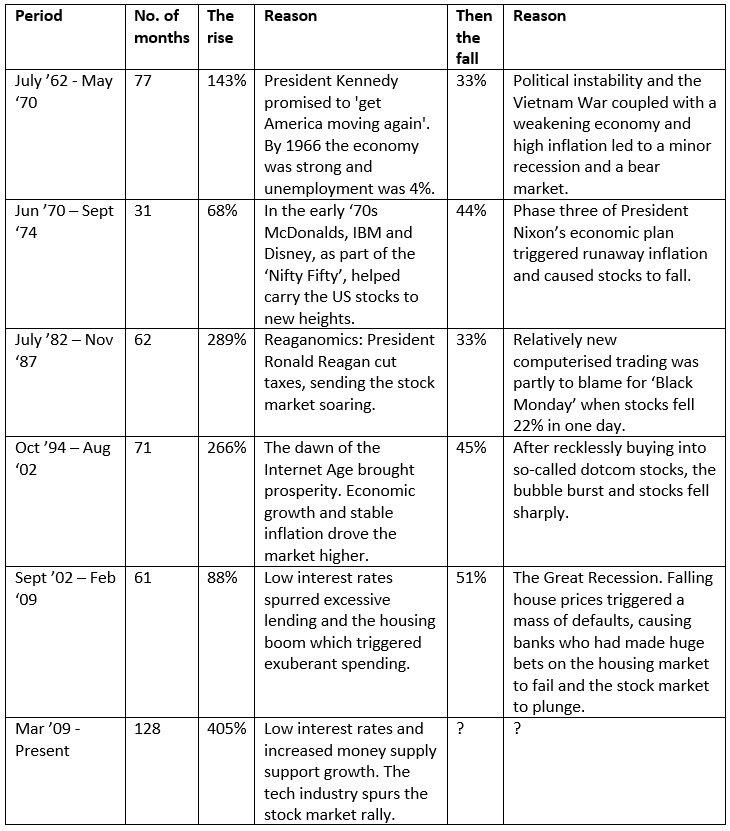
Over the long run since the trough of GFC, the S&P 500 has shot up over 400%. The following chat and table shows the many bull and bear markets since 1962:

Click to enlarge

Source: The six biggest bull runs since 1962 (and their corrections) by David Brett, Schroders

It remains to be seen how long the current bull can run…..

Related ETFs:

  • SPDR S&P 500 ETF (SPY)

Disclosure: No Positions

Beyond Meat: One Heavily Shorted Stock

Fake meat firm Beyond Meat, Inc. (BYND) is one of the most heavily shorted stock at discount brokerages according to a note in The Wall Street Journal yesterday. In addition to the fake meat sector, the cannabis sector is also most shorted by market participants. NASDAQ listed Tilray Inc(TLRY) is one example in the Cannabis space.

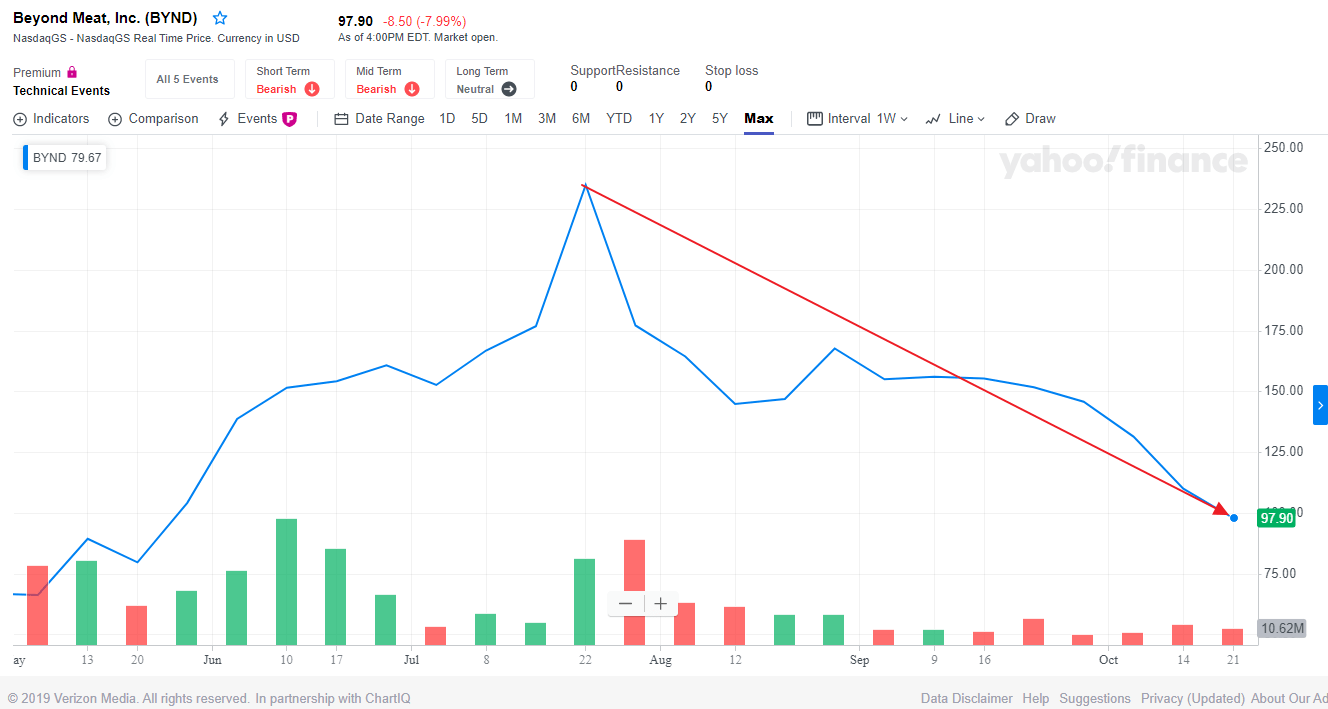
The following chart shows the BYND stock price since its IPO:

Click to Enlarge

Source: Yahoo Finance

After reaching over $234 in July this year, the stock has plunged more than 50% and reached a low of about $98 yesterday. The hype over this new “revolutionary”industry seems to be wearing off. It won’t be a surprise if the stocks goes all the way to low double digits.

For investors looking at shorting, one other possible candidate is Wayfair Inc(W), the online furniture retailer.

Caution: Shorting stocks is not suitable for most retail investors as the potential for losses can be infinite, at least technically. 

Disclosure: No Positions

Global Bear Markets Since 1900: Chart

Bear markets that occur globally have become frequent since 1912. Before that, for a long period of 64 years  from 1848 thru 1912 there were no global bear markets and the entire stretch of 64 years was of peace and economic growth. However all that changes when World War I started in 1914.

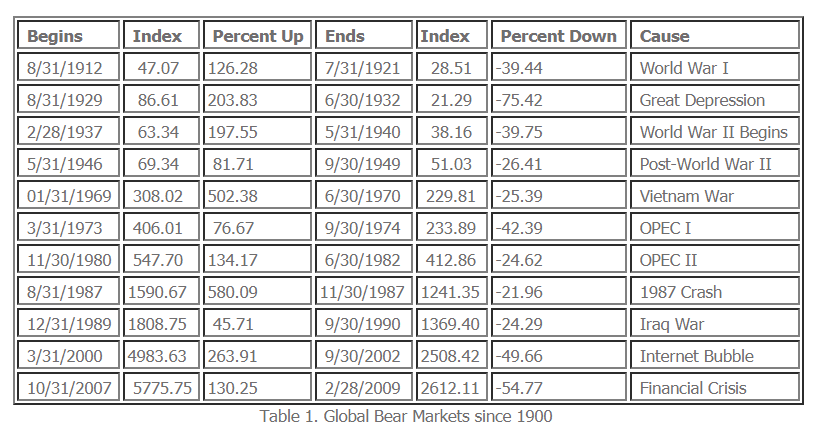
The following table shows the various bear markets at a global level since 1900:

Click to enlarge

Source: Wars and Financial Panics: Global Bear Markets in the Twentieth Century, Investment Office

An excerpt from the above piece:

War hit the world in 1914 when World War I began.  Four bear markets occurred between 1912 and 1949. With the world generally at peace after World War II, recessions, sometimes driven by financial panics, were the main cause of bear markets.  This certainly was the case of the two bear markets that have occurred in the twenty-first century. Over time, bear markets have become more frequent, more integrated, but shorter in duration.  Information on the global bear markets since 1900 is provided in Table 1 using data from the GFD World Index.