On the Explosive Growth of Digital Data: Chart

Data is being created at an astonishing rate today.From Youtube to Twitter to everything in between, billions of people around the world are creating content every day. The dramatic growth in social media in recent years has led to the creation of even more data, For example, millions of videos are uploaded onto Youtube, Facebook, etc. every day. According to one IBM report in 2016, the size of the digital universe may reach a Brontobyte in the coming decade.

How big is a Brontobyte? The following chart shows the answer:

Click to enlarge

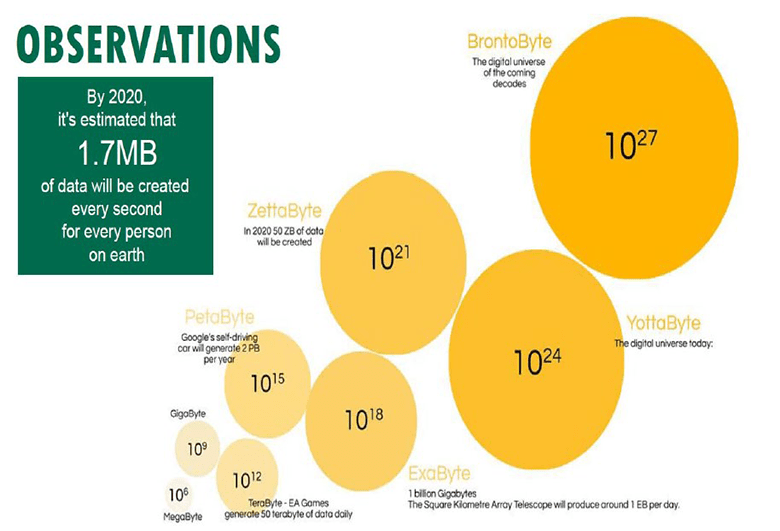
Source: What’s causing the exponential growth of data? by Timoth Greaton, Nikko Asset Management

From the above article:

One of the most interesting statistics about the increasing volume of data appeared in a 2016 IBM report “10 Key Marketing Trends For 2017”, which outlined that 90% of all worldwide data at that time was created in the preceding two years, when 2.5 quintillion bytes of data was created per day. With data volume around the world still growing at an immense pace, it could be a matter of time before the global datasphere reaches a brontobyte (approximately 1,024 yottabytes) in the coming decade (Chart 3).

An interesting question to think about is this: Has the exponential growth of data made people smarter or dumber? Or to put differently, has social media made people more intelligent, educated, cultured and responsible citizens (or) has it made them dumb, foolish and mindless zombies cocooned into their own little world?

US Presidential Election Results in 1928 vs.1932

Extreme financial hardship brought dramatic changes in the past to Germany and the US according to an article by Niels Clemen Jensen at ARP Investments. In Germany, hyperinflation in 1923 and the following Depression brought Hitler to power and led to the rise of Nazism.

The Great Depression in the 1930s led to the dumping of Republican President Hoover and the election of Democrat Franklin Roosevelt by a landslide.

In 1928, Republican Herbert Hoover won both the popular and electoral votes to become the President as shown in the chart below:

Click to enlarge

However after years of suffering in the depression, the American population turned against Republicans and voted in Democrat Franklin Roosevelt.


Source: Five Lessons from History by Niels Clemen Jensen, The Absolute Return Letter, February, 2020

More recently financial hardship directly led to the election of President Trump in the last election including “deplorables” voting for a change.Out of desperation rural folks such as coal miners and others decided to go Republican.

Here is the million dollar question now. Economic issues helped Trump win the last time.With the economy going strong, will voters re-elect him again this time or look for a fresh face in the highest office of the land?

Dividend Withholding Tax Rates by Country for 2020

The Dividend Withholding Tax Rates by Country for 2020 has recently been published by S&P Global. This simple one-page is useful to any investor holding foreign stocks and receiving dividend income. This table shows withholding tax rates for stocks held in regular brokerage accounts only. It does not show the rates for assets held in qualified retirement accounts. For example, the rate for Canada is shown as 25%. This rate does not apply to Canadian stocks owned by Americans in retirement accounts like IRAs. Canada does not charge any taxes on dividends received in those accounts. So investors looking to avoid the withholding taxes can own Canadian stocks in retirement accounts.

Update – Click this link for 2022 rates: Dividend Withholding Tax Rates by Country for 2022

In addition, the 25% rate can be reduced to 15% by filing NR301 form with the Canada Revenue Agency (CRA). For more details on this form go here.

Investors should also pay attention to the difference in rates between REITs and non-REITs. For instance, UK charges no withholding taxes to US residents. However this rate does not apply to UK REITs Dividends paid out REITs would be charged at 20%.

Click to enlarge

Source: S&P Dow Jones Indices

Download:

Earlier:

The World’s Top 20 Arms Producing and Military Service Companies: Infographics

The World’s Top 20 Arms Producing and Military Service Companies are shown in the infographics below. As usual, US firms dominate the list taking 9 out of the 20 spots and 4 out of the top 5. The world’s largest weapons maker is Lockheed Martin(LMT). Though most people know Boeing (BA) as the maker of airliners, the firm is also leads the world in arms manufacturing. A new report shows that China is now the world’s second largest arms producer ahead of Russia. Traditionally Russia ranked the second, behind only the US.

Click to enlarge

Source: The World’s Largest Arms Producers, RFE/RL

The 5-year returns of the top 5 US defense stocks are shown in the following chart:

Source: Yahoo Finance

Most of them have doubled in price with only General Dynamics(GD) logging a growth of 28%.

Disclosure: No Positions