Pyramid Distribution of US Equity Returns 1825 To 2019: Chart

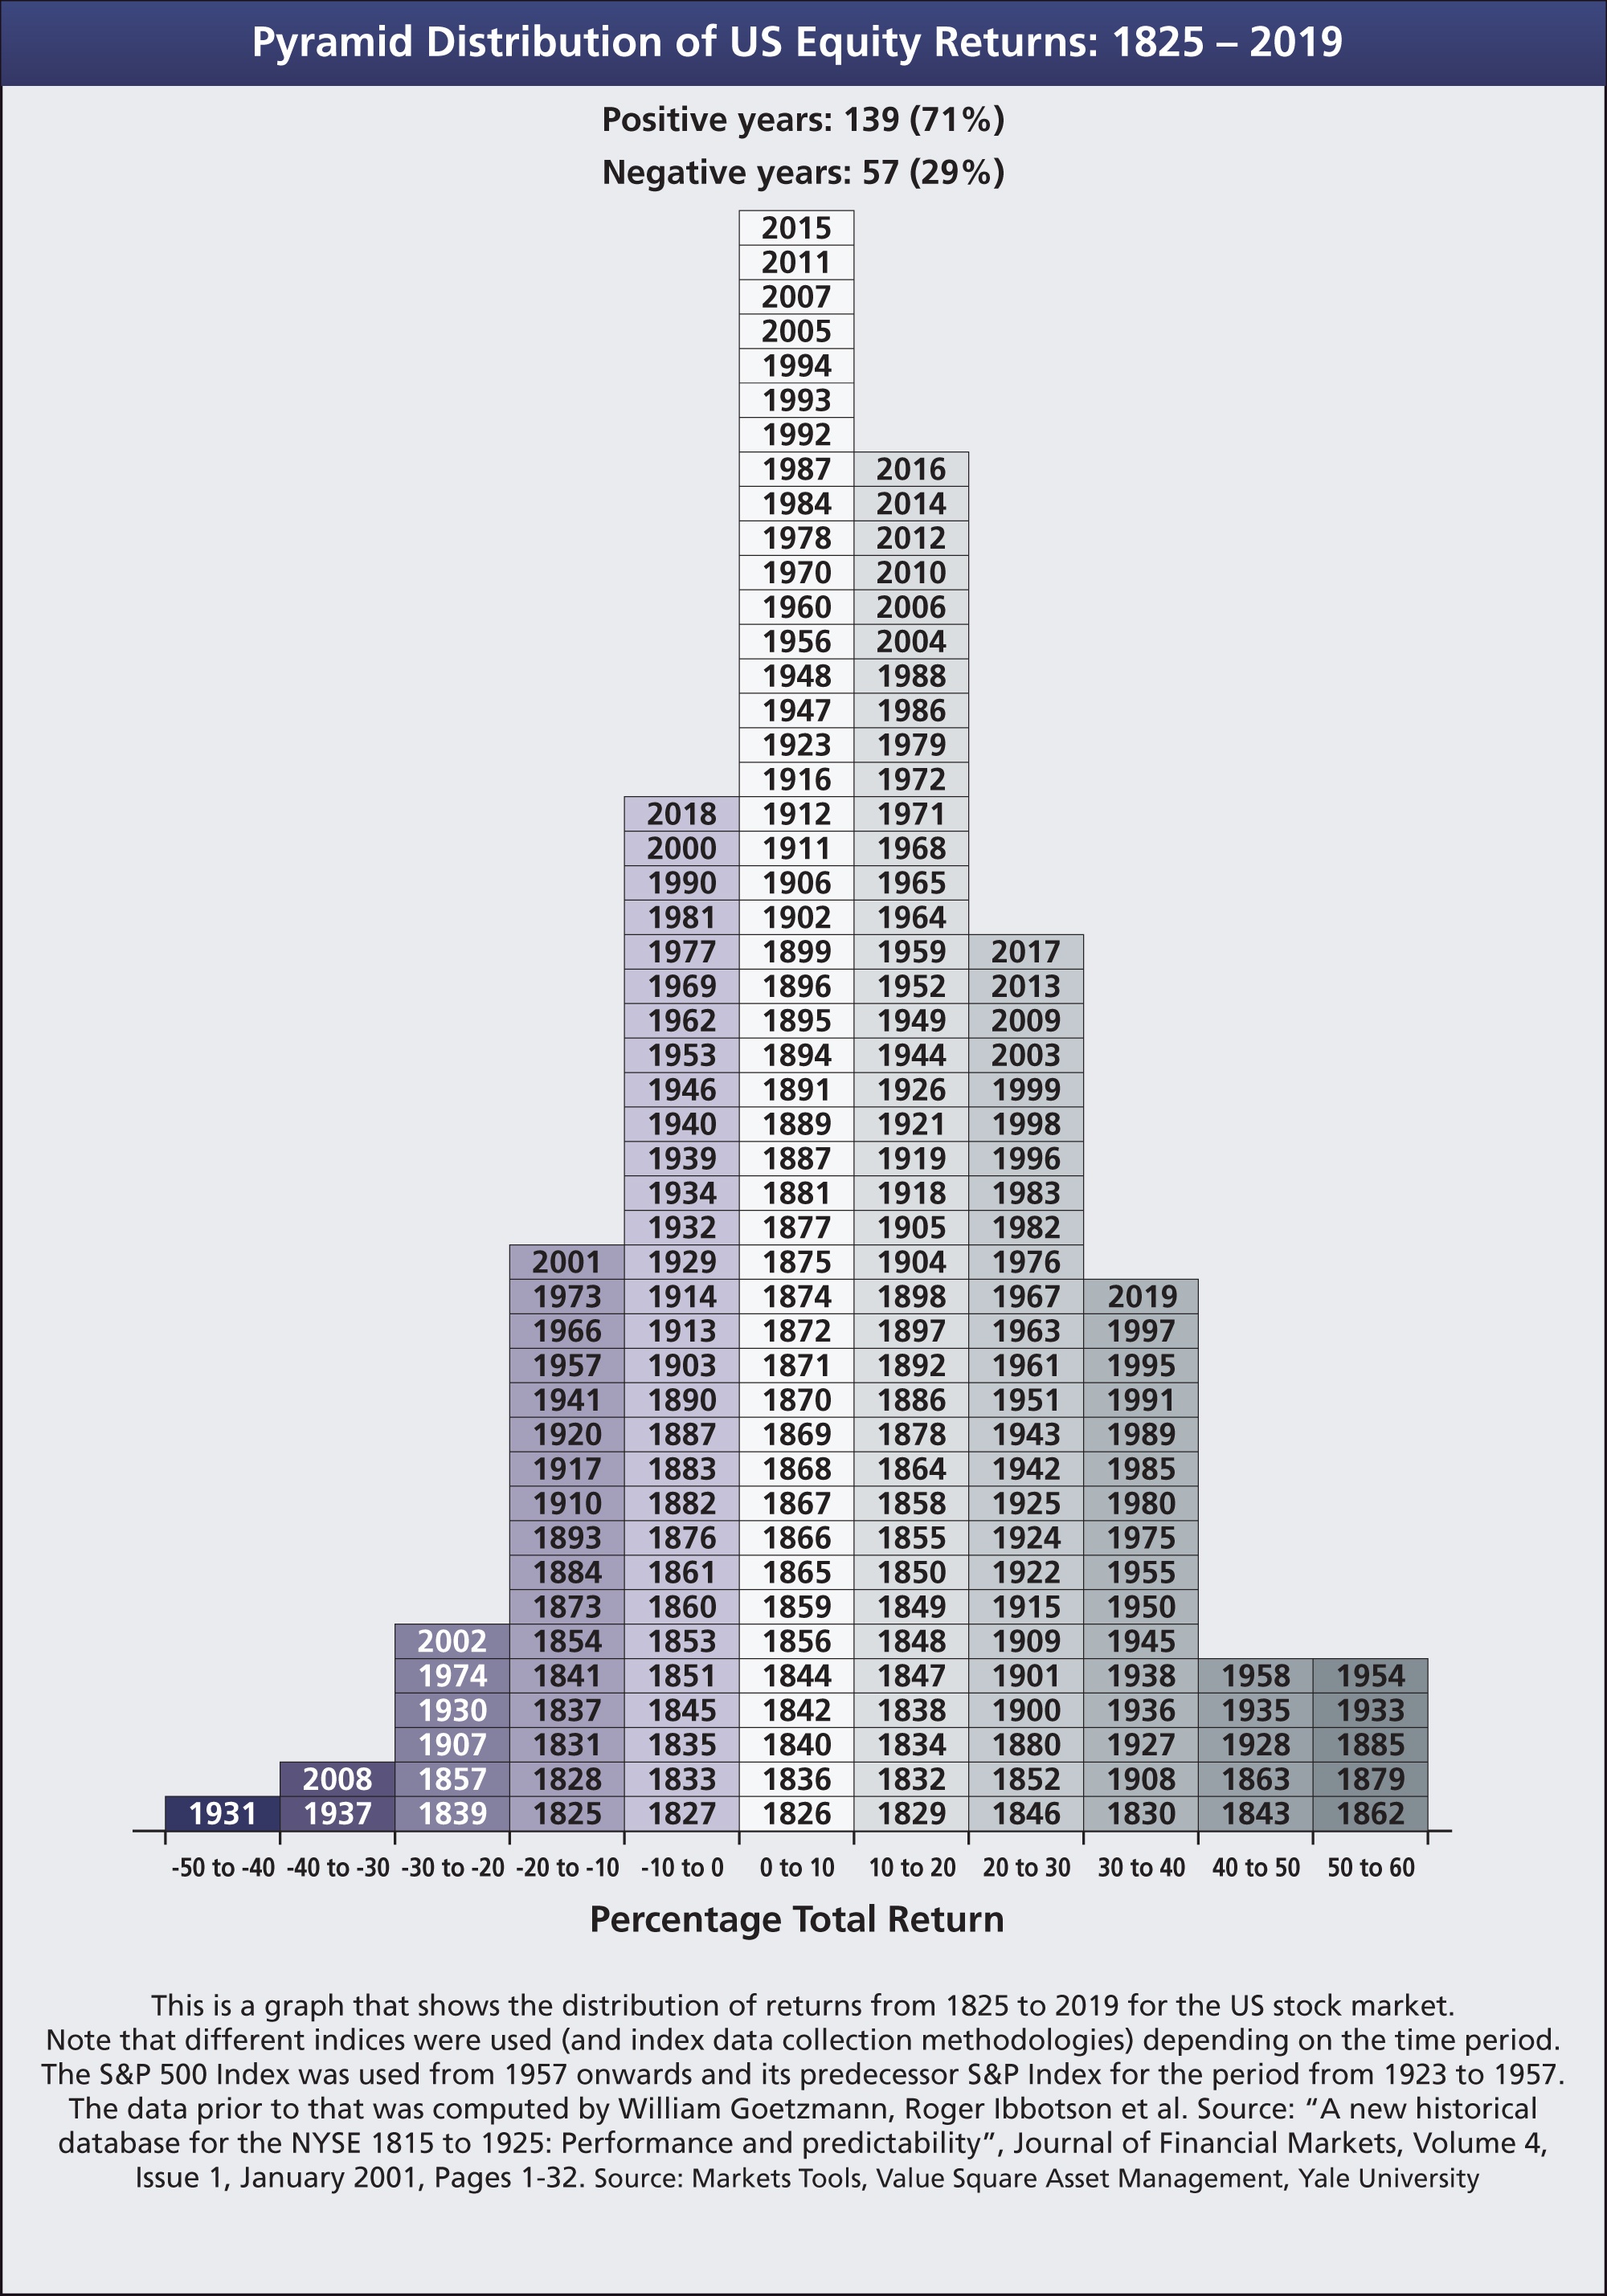
Equities tend to go higher in the long run. In the really long run measured in decades stocks definitely yield a positive return. US stocks have had a positive years 71% versus negative years in 29% of the time from 1825 through 2019. The annual returns shown in the below pyramid are total returns which includes dividend reinvested.

Click to enlarge

Source: Investment Office

Related ETF:

  • SPDR S&P 500 ETF (SPY)

Disclosure: No Positions

Investors Should Monitor US Bank Stocks

The US equity market recovered strongly from the lows reached in March only to start plunging again in the past few days. Fears of a second wave of Covid-19 infections and soaring death toll is taking a toll on the market. Not to mention the astonishing rise in the number of unemployed Americans that total over 36 million now. These millions of individuals are not only not working but also not consuming much as their income has suddenly evaporated. This will have a tremendous impact on banks in the country.

As the banking sector is considered as the pillar of the economy, it is very important to keep an eye on the performance of banks. Unemployed people are going to have trouble paying everything from car loans to credit cards to mortgages to everything in between. In addition to that, not many are going to get a new loan to buy things like a house, car, go on a nice vacation, etc. The KBW Bank Index has declined substantially year-to-date. This index represent the 24 major banking institutions in the country. As of market close yesterday the index is down just over 42%.

The KBW Bank Index Year-to-date Return:

Click to enlarge

Source: Google Finance

Most of the major banks are trading at or close to 52-week lows. For example, regional lender US Bank(USB) closed at $31.17 today which is not far from the 52-week low of $28.36.

The full list of US bank stocks trading on the NYSE can be found here. And the ones listed on the NASDAQ are here.

Declining share prices have raised the dividend yields of bank stocks. However not all banks are secure dividend plays at this time. Reduction or suspension of dividends is anticipated at least for some of the banks. Below is an excerpt on this topic from an article at Marketwatch:

Investors are looking ahead to a difficult credit cycle. The Dodd-Frank legislation in 2010 raised banks’ capital requirements and strengthened regulatory oversight. There is no talk of bank bailouts this time around.

Then again, Federal Reserve Chairman Jerome Powell said Wednesday that a survey by the central bank found that 40% of people in households earning less than $40,000 a year that were counted on payrolls in February had lost their jobs in March.

That points not only to loan forbearances and credit losses, but also to continued pain for countless businesses of all sizes that owe money to the banks.

So it is not surprising that some banks have already reduced their dividends to shore up cash.

Source:Wells Fargo leads list of bank stocks at risk for dividend cuts, Marketwatch

Should the economy get even worse and there is on improvement in the unemployment levels or COVID-19 situation, we can expect further hair cuts in the stock prices of banks. Now is not the time to jump into this volatile sector. But interested investors can keep an eye for the evolving landscape.

Disclosure: Long USB


The Top Potato Eating Countries: Infographic

The top potato eating country on per capita basis in the world is Belarus. Popular wisdom may hold that it is Ireland but it is not true. The next top potato eating countries are Ukraine and Latvia followed by Russia. The US is not in the top ten countries for potato consumption.

Click to enlarge

Source: Radio Free Europe/Radio Liberty

Updates (2/11/24):

1.Potato Consumption per Country in Europe 2023:

Click to enlarge

Source: @theworldmaps via VividMaps

2.Which Country Eats the Most Potatoes?:

Source: Which Country Eats the Most Potatoes?, HelgiLibrary

3.Potato Consumption Per Capita  2023:

Source: Potato Consumption Per Capita, HelgiLibrary

4.Potato Consumption in Europe:

Source: Potato Consumption in Europe,   Landgeist

You may also like:

Dow Jones Index During Depression And After: Chart

The US equity market plunged dramatically in 1929 triggering the Depression. From the peak of 1929 to the bottom reached in 1932, millions were unemployed and untold misery was brought upon the general population.After FDR was inaugurated as the 32nd President of the United States the economy slowly started to recover.

The chart below shows the returns of the Dow Jones Index from 1929 through 1940:

Click to enlarge

Source: Stock Markets during the second World War, Investment Office

GRANOLAS: The 11 Best European Superstar Stocks

European stocks are under-performing American stocks at least so far this year. Despite COVID-19 and the ensuing economic chaos, the S&P 500 is down just 12.4% year-to-date. After a dramatic plunge in February and March, equities have rallied sharply. However nobody knows if this rally will hold through the rest of the year.

Compared to the S&P 500, the major European indices have declined more. Germany’s DAX Index is off 18% while the benchmark indices of France, Spain and the UK are all down by over 23% or double of that the S&P 500 year-to-date.

With that brief intro, let’s discuss about growth opportunities in Europe. Unlike the US, Europe is not known for its leadership in the tech sector. There are no European Alphabet (GOOG), Amazon(AMZN), Netflix(NFLX), Apple(AAPL) or Facebook(FB). The reasons for this dismal situation are beyond the scope of this post. However it is possible to find European companies that have decent growth rates.For instance, Europe is home to some world-leading firms in the pharmaceutical and consumer staples sector. The world’s top company for diabetes drugs is based in Denmark. Similarly Switzerland is the home base of consumer good giant Nestle(NSRGY) and pharma majors Roche(RHHBY) and Novartis(NVS).

A recent article in Money Observer discussed a research note from Goldman Sachs that  identified the top growth companies in Europe. Similar to moniker FAANG, they assigned the acronym GRANOLAS to this list of high growth European stocks. From the article:

The past decade saw large cap US tech stocks consistently outperform the rest of the market. Anyone with a high weighting towards the likes of Facebook, Apple, Amazon, Netflix and Alphabet (Google) would have outperformed in an already strong bull market. As a result, they earned the collective moniker “Faang stocks,” an acronym for the names of the five companies.

When it comes to European stocks, however, Goldman Sachs, in a new research note, says the so-called GRANOLAS have been the stars. The new acronym stands for GlaxoSmithKline, Roche Holding, ASML, Nestlé,, Novartis, Novo Nordisk, L’Oréal, LVMH, AstraZeneca, SAP and Sanofi.

The past decade has been characterised by low interest rates, slow economic growth and weak earnings growth. Broadly, this has benefited large cap growth tech stocks such as the Faangs.

However, notes Goldman Sachs: “Europe lacks growth companies in general, and in the Technology sector in particular.” Instead, GRANOLAS, all companies with relatively strong balance sheets, low volatility growth and good dividend yields, emerged as Europe’s post-financial crisis winners.

Source:  GRANOLAS: The new acronym for Europe’s superstar stocks, Money Observer

Indeed the GRANOLAS are worth considering for investment in these uncertain times. The tickers on the American markets and current dividend yields of this group of stocks are listed below:

1.Company: GlaxoSmithKline (GSK)
Current Dividend Yield: 6.01%
Sector: Pharma
Country: UK

2.Company: Roche Holding AG (RHHBY)
Current Dividend Yield: 2.65%
Sector: Pharmaceuticals
Country: Switzerland

3.Company: ASML Holding NV (ASML)
Current Dividend Yield: 1.04%
Sector: Semiconductor
Country: The Netherlands

4.Company: Nestle SA (NSRGY)
Current Dividend Yield: 2.64%
Sector: Food Products
Country: Switzerland

5.Company: Novartis AG (NVS)
Current Dividend Yield: 3.65%
Sector: Pharmaceuticals
Country: Switzerland

6.Company: Novo Nordisk A/S (NVO)
Current Dividend Yield: 1.94%
Sector: Pharmaceuticals
Country: Denmark

7.Company: L’Oréal S.A. (LRLCY)
Current Dividend Yield: 1.51%
Sector: Personal Care
Country: France

8.Company: LVMH Moet Hennessy Louis Vuitton SA (LVMUY)
Current Dividend Yield: No Dividend Paid
Sector: Luxury Goods
Country: France

9.Company: AstraZeneca PLC (AZN)
Current Dividend Yield: 2.70%
Sector: Pharmaceuticals
Country: UK

10.Company: SAP SE (SAP)
Current Dividend Yield: 1.46%
Sector: Software
Country: Germany

11.Company: Sanofi (SNY)
Current Dividend Yield: 3.74%
Sector: Pharmaceuticals
Country: France

Note: Dividend yields noted above are as of May 1, 2020. Data is known to be accurate from sources used.Please use your own due diligence before making any investment decisions.

Disclosure: No Positions