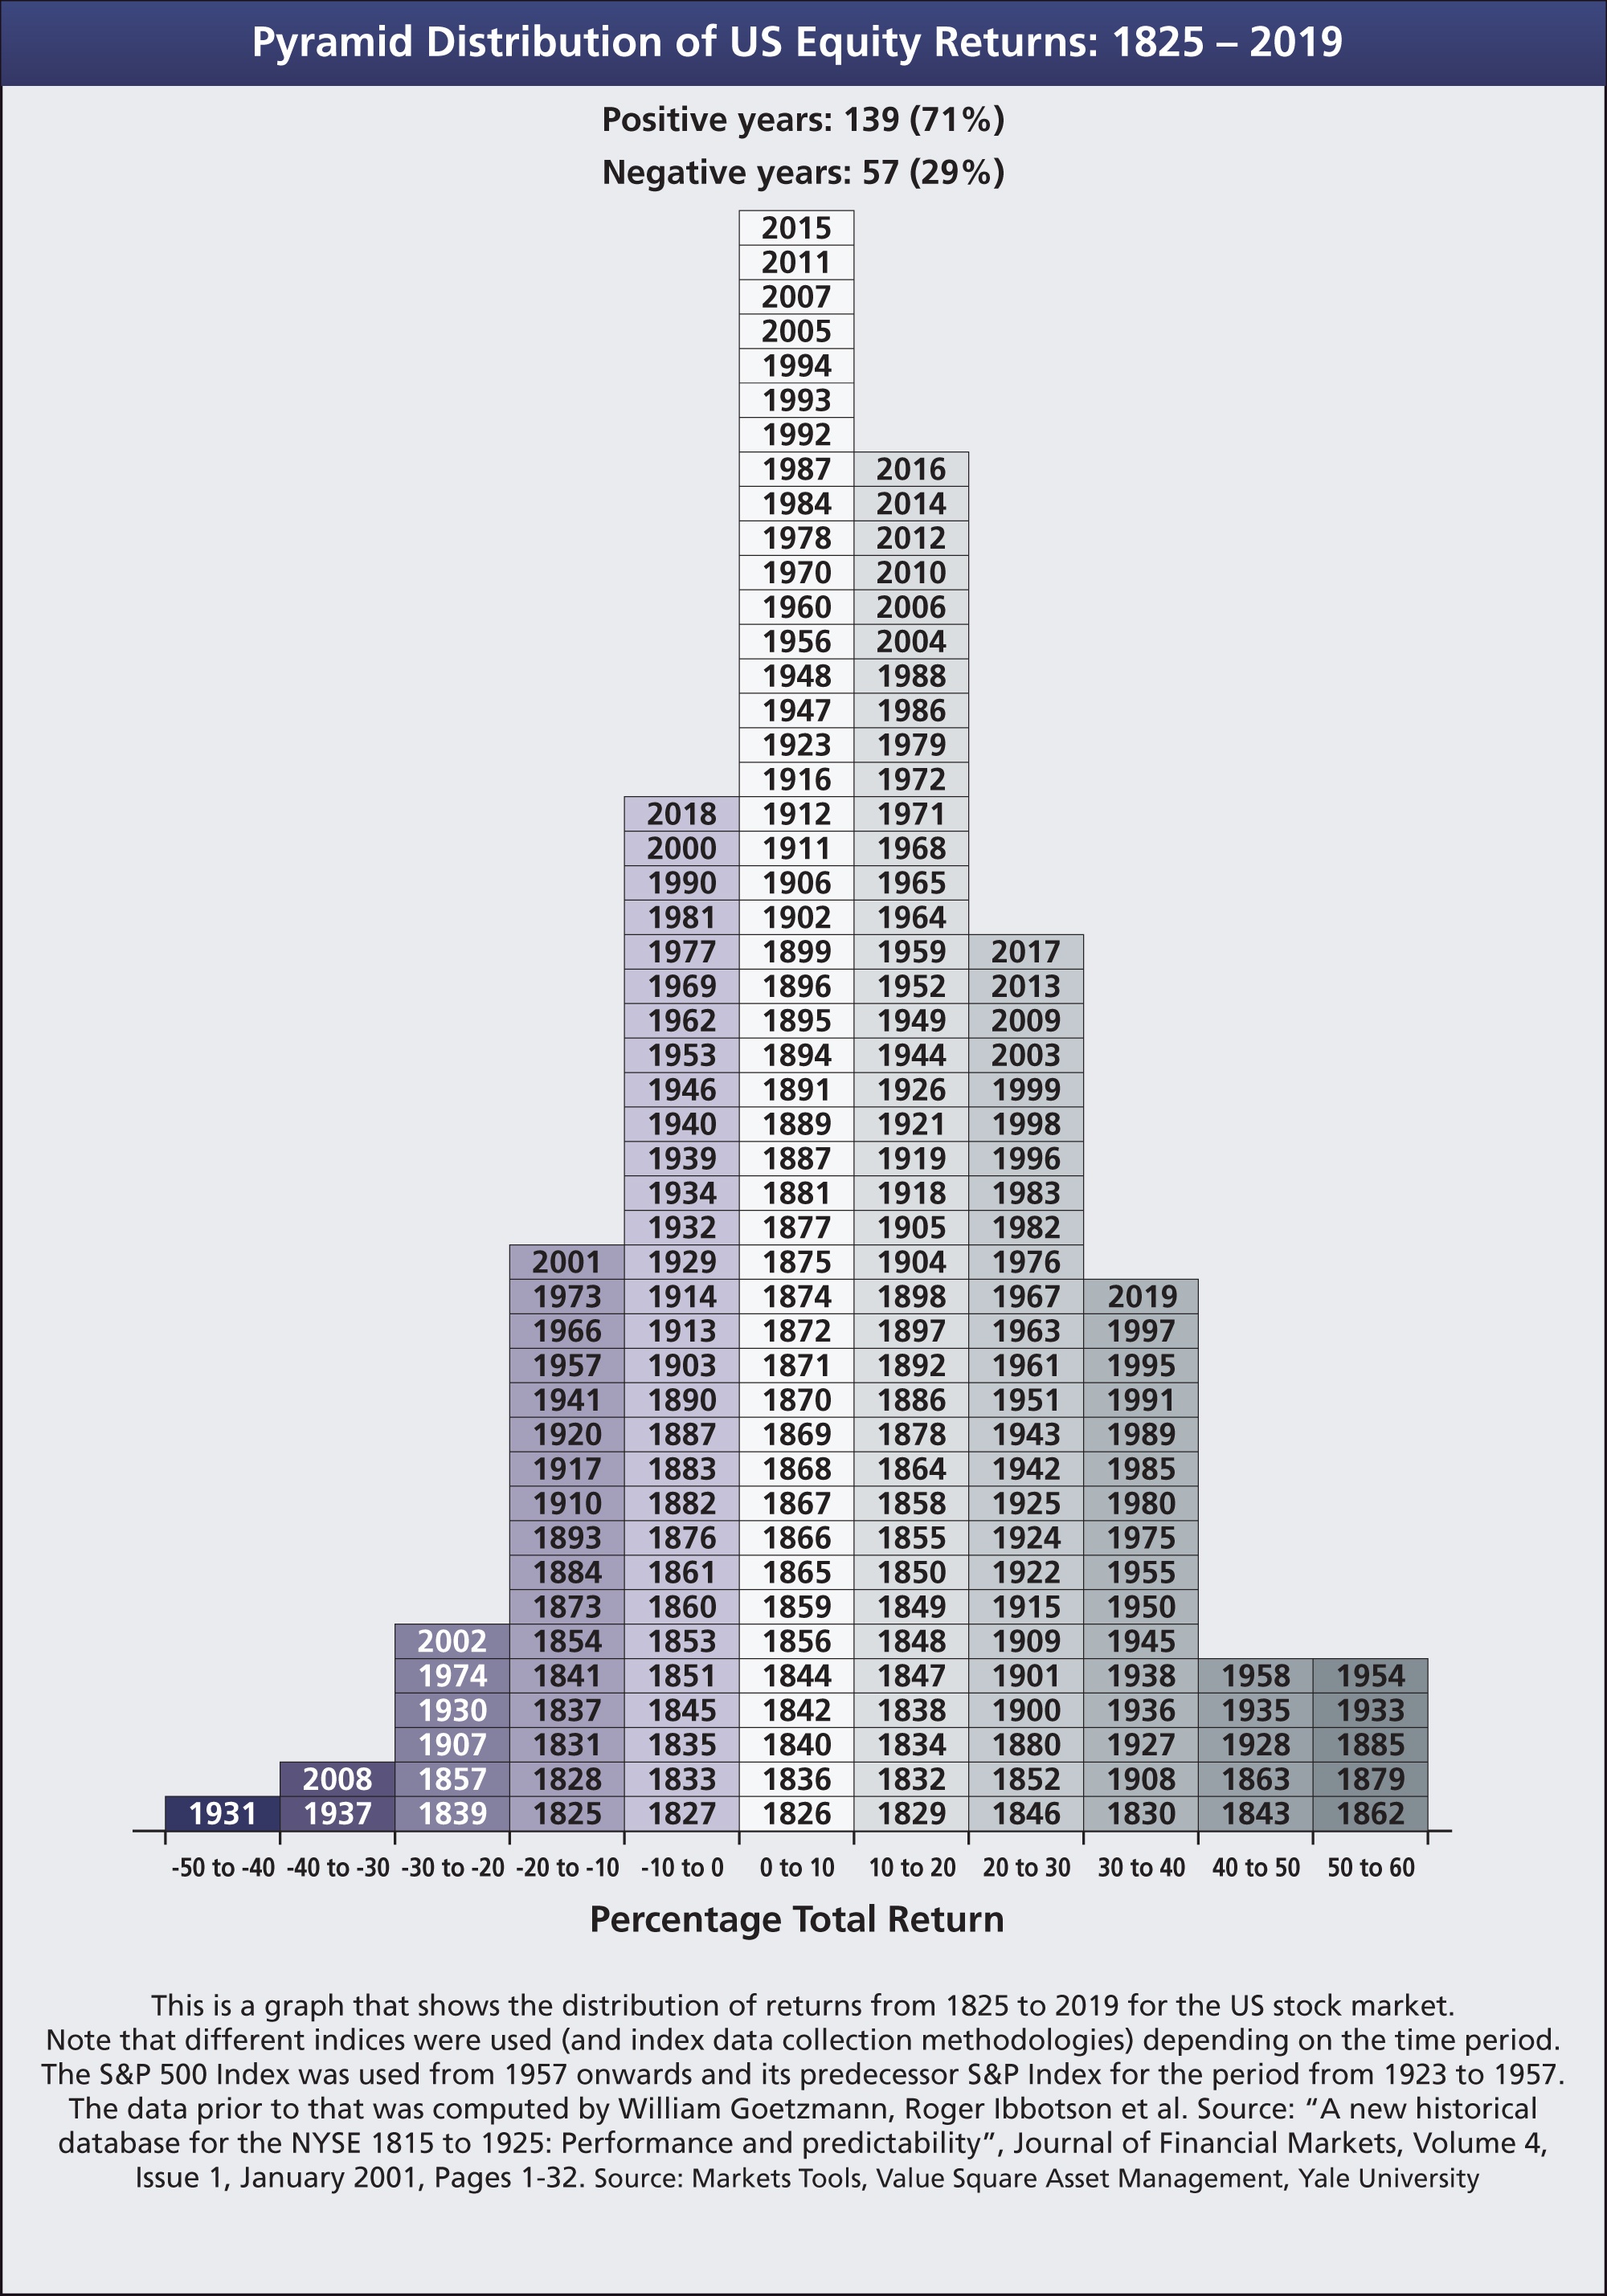
Equities tend to go higher in the long run. In the really long run measured in decades stocks definitely yield a positive return. US stocks have had a positive years 71% versus negative years in 29% of the time from 1825 through 2019. The annual returns shown in the below pyramid are total returns which includes dividend reinvested.
Click to enlarge
Source: Investment Office
Related ETF:
- SPDR S&P 500 ETF (SPY)
Disclosure: No Positions
