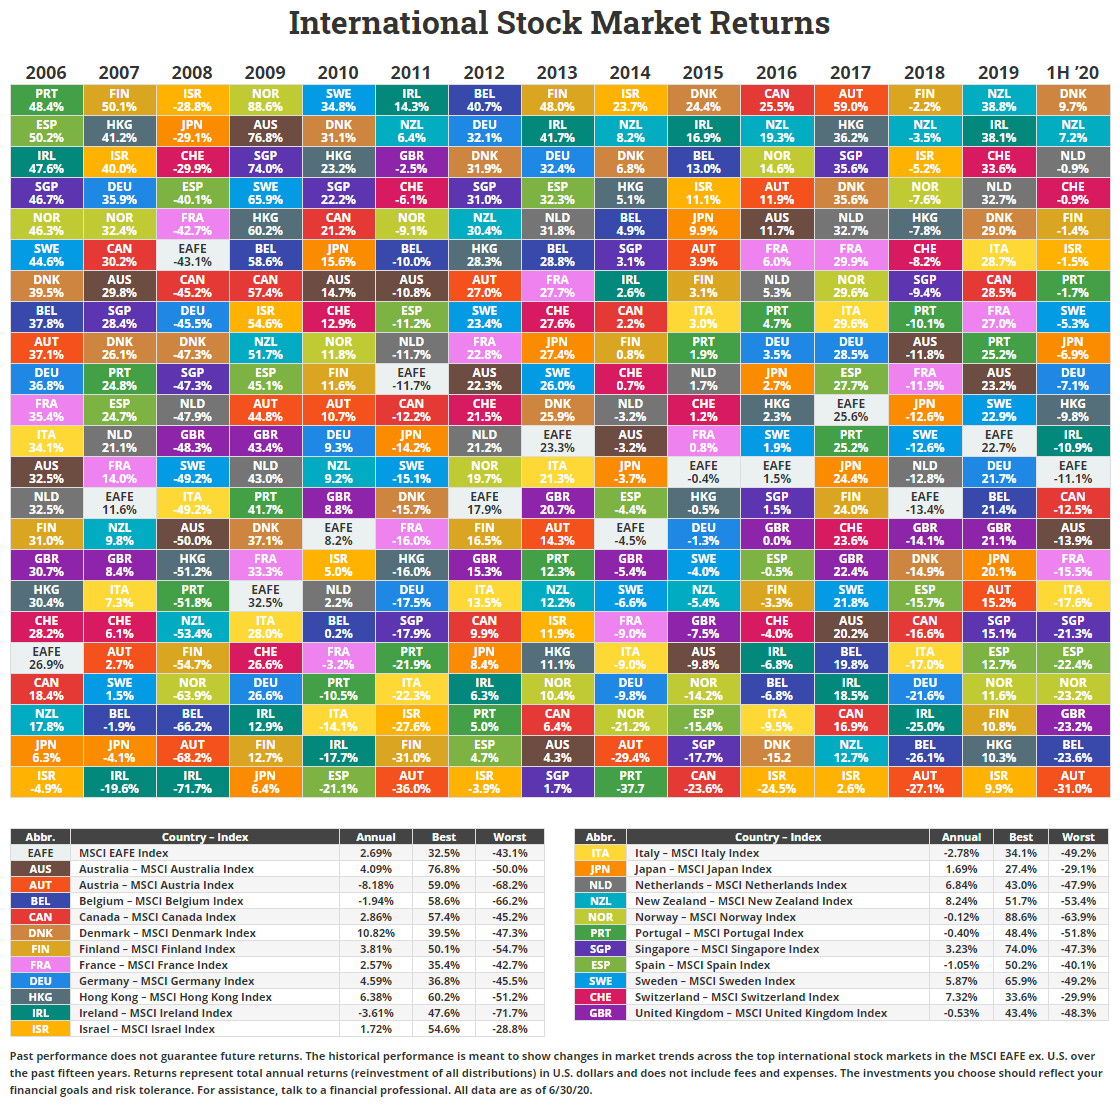
Callan LLC recently published their Callan Periodic Table of Investment Returns with data updated thru first half of this year. Real Estate was the worst performer until the end of June with a loss of over 21%. The asset class that yielded the best returns was US Fixed Income with a return of over 6%.
Click to enlarge
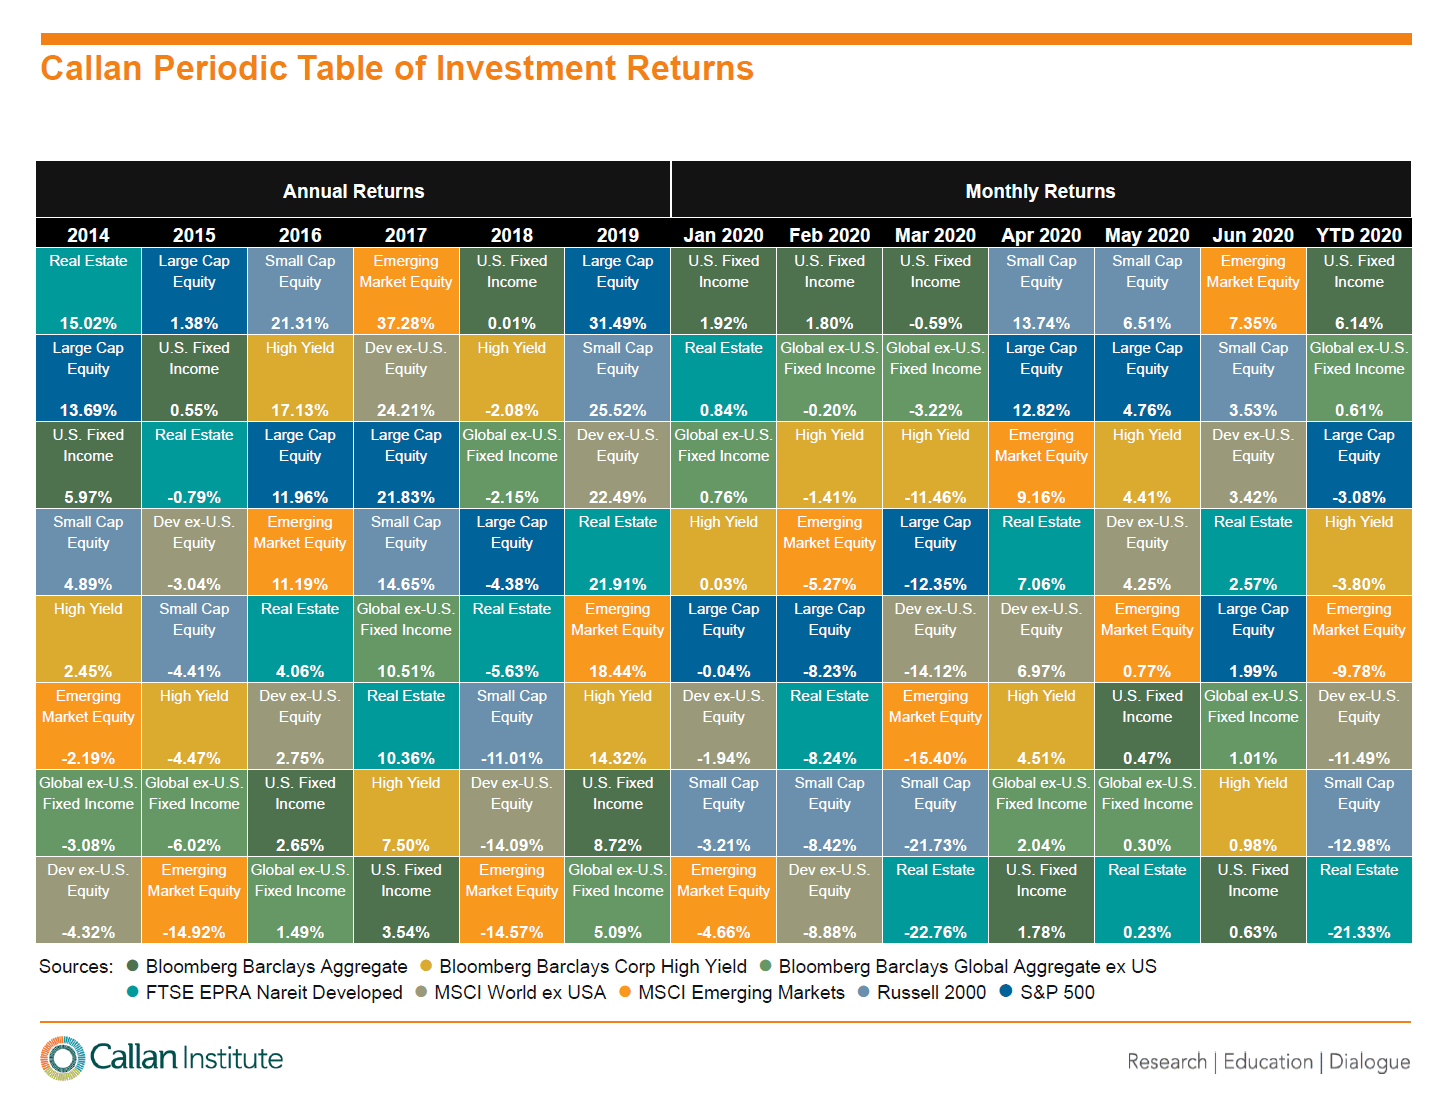 Source: Callan
The key takeaway from this chart is that diversification is the important to success. For instance fixed income was the top performer for the first three months, then it was small caps and emerging market stocks were the best in June.