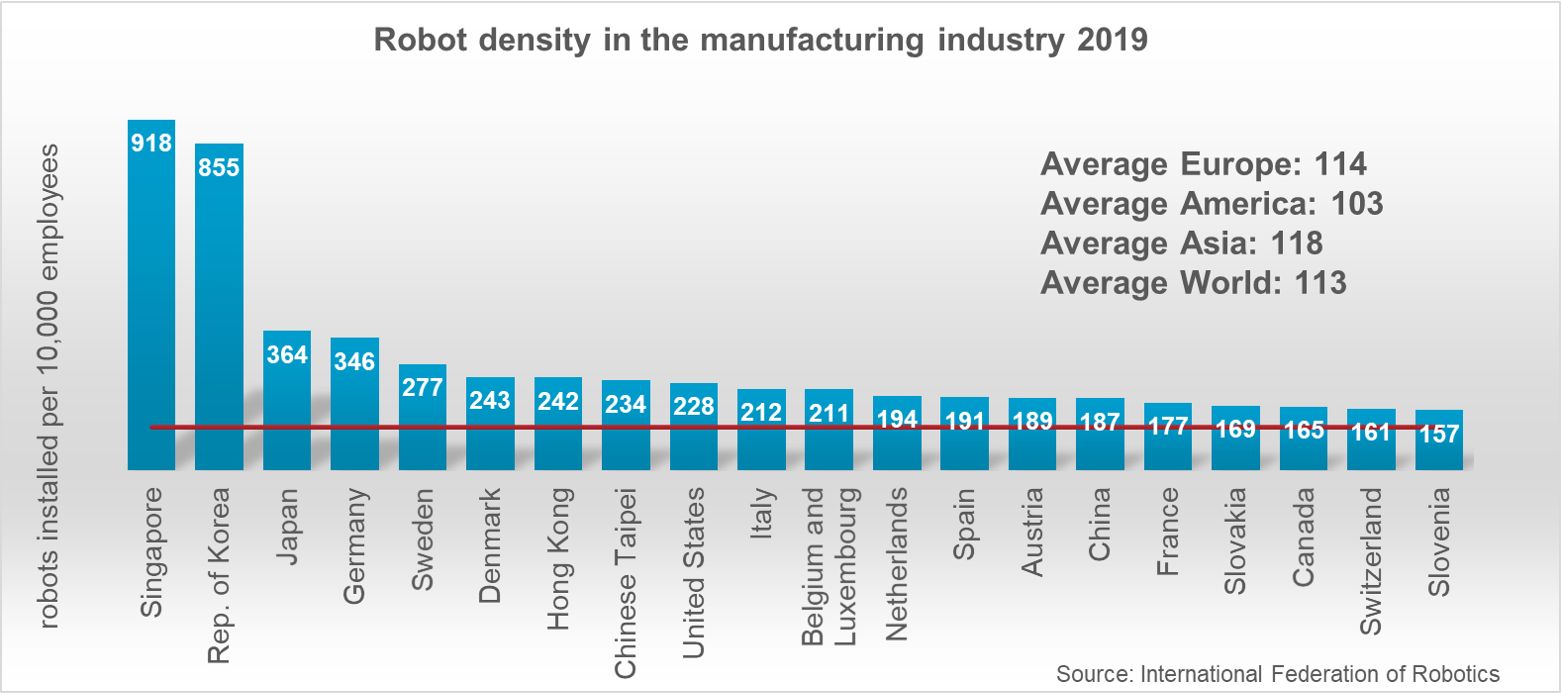
Annual Returns of Gold vs. Other Assets 1980 To 2019: Chart

Gold is an important asset class that is good to own during bull and bear markets although a small portion of a well-diversified portfolio should suffice. During bull markets in equities gold may not earn high returns. However during bear markets or when uncertainty plagues the market such as now then gold is a great asset to have in one’s portfolio. The soaring prices of gold is evidence of this. With that said, how has gold performed over other asset classes in the past few years?

The following chart provides some answers. It shows the annual returns of gold and other asset classes such as cash, US stocks, bonds, etc. from 1980 to 2019:

Click to enlarge

Source: Bullion Vault

Gold was the best performer during past crises such as in 2002 when US stock plunged. Ever since the dot com crash, gold has yielded positive returns in all the years except in 2013, 2014 and 2015.

Related ETF:

  • SPDR Gold Trust(GLD)

Disclosure: No positions

Average Holding Period for U.S. Stocks is Just 5-1/2 Months in 2020

The average holding period for US stocks has been declining for many years now. In the 1940s the average duration was 7 years. By the turn of this century it had fallen to below 1 year according to an article I wrote in 2010. A recent study earlier this year by researchers at MFS showed the holding period for NYSE-listed was 9 months.

A Reuters article noted that the average holding period for US stocks has declined to 5-1/2 months in June. From the article:

The length of time that investors hold shares has been shrinking for decades but the trend accelerated this year in volatile markets that have made people nervous about sitting on investments for too long.

There are different ways of slicing it, but Reuters calculations based on New York stock exchange data show the average holding period for U.S. shares was 5-1/2 months in June, versus 8-1/2 months at end-2019.

The previous record low of six months was hit just after the 2008 crisis. In 1999, for example, 14 months was the average.

Europe displays a similar trend, with holding periods shrinking to less than 5 months, from 7 months last December.


Source: Buy, sell, repeat! No room for ‘hold’ in whipsawing markets, Reuters

The reasons for the continuing decline in holding periods are many. Some of them include commission-free trading from discount brokers to others, 0% interest rates, pandemic-induced volatility, sports gamblers that are bored to death at home due to lack of sports betting, millennials living in their parents’ basements with nothing else to do, day-traders by the millions playing the market using the Robinhood app, unemployed people trying to multiply their $600+ weekly unemployment checks and also have fun doing it, the same people also throwing the $1,200 stimulus checks into the market to make some money to pay bills, etc. Not to mention algorithm-based machine trading by big institutions, locked-down realtors unable to flip houses finding their luck in the stock market, etc.

Whatever the cause, ultimately the inability of investors to hold stocks for the long-term is negative for the market and investors. Simply churning stocks all day long or even holding them for only a few months will not lead to a strong and growing equity market.

Related Posts:

Water Utility Stocks Offer Stability And Growth During These Uncertain Times

The utility sector is considered as one of the conservative and defensive sectors. Utility companies tend to be slow growth, stable and well-established dividend payers that some investors prefer to own. In most states in the US, utilities are highly regulated and are traditionally monopolies in their regional markets. Within the utility sector, water utilities are the most defensive and safest bets. This is because, water is the most basic necessities that everybody needs to live. In this post, let’s take a quick look at some of the players in this largely unpopular part of the US equities market.

The water utilities sector is relatively small with just nine publicly traded companies. Out of these, only two have market cap of above $10 billion. The top three firms in this sector are Essential Utilities(WTRG), American States Water(AWR) and American Water Works(AWK). Another notable player is York Water(YORW).

According to an article in the WSJ earlier this year, the water sector has a low dividend of 1.91% compared to 2.61% for electric and 3.99% for gas utility sectors. However water companies grow their dividends consistently and the dividends are most reliable.

1.Essential Utilities(WTRG):

Essential Utilities, Inc., formerly Aqua America, Inc., is a holding company engaged in providing water or wastewater services in the states of Pennsylvania, Ohio, Texas, Illinois, North Carolina, New Jersey, Indiana and Virginia. It is the holding company for its primary subsidiary, Aqua Pennsylvania, Inc. Its conducts business through Aqua Resources, Inc. (Aqua Resources) and Aqua Infrastructure, LLC (Aqua Infrastructure).

Currently the market cap is over $11 billion and the dividend yield is 2.04%.

2.American States Water(AWR):

American States Water Company (AWR) is a holding company. The Company’s segments include water, electric and contracted services.

Current market cap is about $3.0 billion and the dividend yield is 1.53%. It has raised dividends for the past 64 years with an average total return of 15% from 2009 to 2019.

3.American Water Works(AWK):

American Water Works Company, Inc. is a holding company for regulated and market-based subsidiaries throughout the US and Ontario, Canada. The Company’s Regulated Businesses segment provides water and wastewater services as public utilities in 16 states in the United States. The Market-Based Businesses consists of four segments, including Military Services Group, which conducts operation and maintenance (O&M) of water and wastewater systems for military bases; Contract Operations Group, which conducts O&M of water and wastewater facilities for municipalities and the food and beverage industry; Homeowner Services Group, which primarily provides water and sewer line protection plans for homeowners, and Keystone, which provides water services for natural gas exploration and production companies.

AWK is the largest water utility with a market cap of over $26.0 billion.

4.York Water(YORW):

York Water Company is a water utility in the United States. The primary business of the Company is to impound, purify to meet or exceed safe drinking water standards and distribute water. The Company also owns and operates approximately two wastewater collection systems and two wastewater collection and treatment systems. The Company operates within its franchised water territory, which covers approximately 39 municipalities within York County, Pennsylvania and nine municipalities within Adams County, Pennsylvania. Its wastewater operations include portions of five municipalities in York County, Pennsylvania.

York is a mid-cap stock with a market cap of about $615.0 billion. The company has paid a dividend each quarter since 1816, the largest streak in the US equity market.

The 5-year return of three stocks are shown in the chart below. American Water Works has had a solid growth of 185%.

Click to enlarge

The year-to-date returns of the all the four stocks are shown below:

Note: Dividend yields noted above are as of July 30, 2020. Data is known to be accurate from sources used.Please use your own due diligence before making any investment decisions.

Source: Yahoo Finance

The other publicly-traded water utilities are:

  • Middlesex Water Co (MSEX)
  • Pure Cycle Corp (PCYO)
  • Companhia de Saneamento Basico do Estado de Sao Paulo SABESP (SBS) of Brazil
  • Artesian Resources Corp (ARTNA)
  • Consolidated Water Co Ltd (CWCO)
  • SJW Group (SJW)

Source: Just one word: Water!, WSJ

Disclosure: No Positions

The World’s Top 50 Mining Companies

The largest 50 mining companies in the world based on market capitalization as compiled by Mining.com are shown in the table below. According to their research these firms had a combined market value of $957 billion at the end of June, 2020. Precious metal companies were the winners so far this year as gold prices have especially soared.

Click to enlarge

Notes:

Data Sources: MINING.COM, MiningIntelligence, Morningstar, GoogleFinance, company reports. Trading data from primary-listed exchange where applicable, currency cross-rates Jul 1 2020. *Percentage change based on US$ market cap difference, not exchange price in local currency.

Source: Monster rally adds $250 billion to global top 50 mining companies, Mining.com

Related ETF and stocks:

Gold Prices Are Soaring This Year

Gold prices are climbing to record highs this year. Prices reached $1,900 yesterday in the futures market. This is the highest levels since 2011. Gold prices are in a tear this year due to coronavirus-induced recession. The yellow metal may continue to rise as investors seek safe-heaven assets in uncertain times such as now. Though gold does not produce income like a dividend paying stock for example it is considered as an asset that stores value. Fiat currencies including the US dollar are just paper and can reduce in value. In fact, the value of the dollar today is not the same as it was in 50 years or 20 years. Every year the value of the paper dollar loses its value due to inflation.

With that brief intro, below is an excerpt from an article in the journal this weekend:

Expectations for the world’s central banks and governments to continue flooding the global economy with cash are also lifting demand for bullion. Ultralow interest rates make gold more appealing because the metal offers no income simply from holding it. Many analysts also expect historic stimulus measures to eventually spur inflation, eroding the purchasing power of paper money and boosting the value of precious metals.

European Union leaders recently reached an agreement on more than $2 trillion in spending, and traders anticipate U.S. lawmakers will soon approve additional coronavirus aid.

“You couldn’t create a better playbook for gold to perform,” said Steven Dunn, head of ETFs at Aberdeen Standard Investments, which manages the roughly $2.2 billion Aberdeen Standard Physical Gold Shares ETF. Gold-backed ETFs have taken in billions of dollars in recent months.

Many big-name investors including Ray Dalio, Jeffrey Gundlach and Paul Tudor Jones have touted the benefits of owning the metal in recent months, with the pandemic stinging business activity and a global pile of debt expanding.


Source: Gold Climbs to a High, Topping Its 2011 Record, WSJ, July 24, 2020

From an article by Jason Zweig at the journal:

In the aftermath of the 2008-09 global financial crisis, investors piled into gold on the belief that low interest rates and trillions of dollars in government spending would ignite hyperinflation and make gold more valuable.

Gold shot up close to $1,900 in the summer of 2011, but the hyperinflation never materialized. In real, inflation-adjusted terms, gold gained about 6% annually in both 2011 and 2012, then lost 38% from 2013 through 2015, according to Christophe Spaenjers, a finance professor at the HEC Paris business school in Jouy-en-Josas, France. By late 2015 the gold price had sagged to $1,050.

Gold is, in fact, a poor hedge against inflation. Accounting for changes in the cost of living, gold has returned an average of minus 0.4% annually since 1980, versus positive annualized returns of 7.9% for U.S. stocks, 6.2% for U.S. bonds and 1.2% for cash, according to Prof. Spaenjers.

Adjusted for inflation, he reckons, gold would still have to rise approximately 52% from this week’s prices to match its level of January 1980. That is when it peaked in inflation-adjusted terms.

So you hear less about gold’s purported inflation-fighting powers nowadays. Instead, fans argue the dollar is losing value and, above all, that low interest rates in the U.S. and negative rates elsewhere will drive gold higher.

That makes some sense. It costs money to store and insure gold, which—unlike cash or bonds—produces no income. When the return on cash is nil or negative after inflation, gold’s income disadvantage disappears. Investors then become more willing to “look to assets where the value will at least be retained, which benefits gold,” Ms. Cooper says.

Source: A Golden Rule From a Golden Fool, WSJ, July 24, 2020

The below shows the 20-year return chart of gold:

Click to enlarge

Source: GoldPrice.Org

The Top 10 gold mining companies in the world:

Source: Top 10 biggest gold mining companies in the world, Mining.com

Related ETF and stocks:

Related Posts:

Disclosure; No Positions