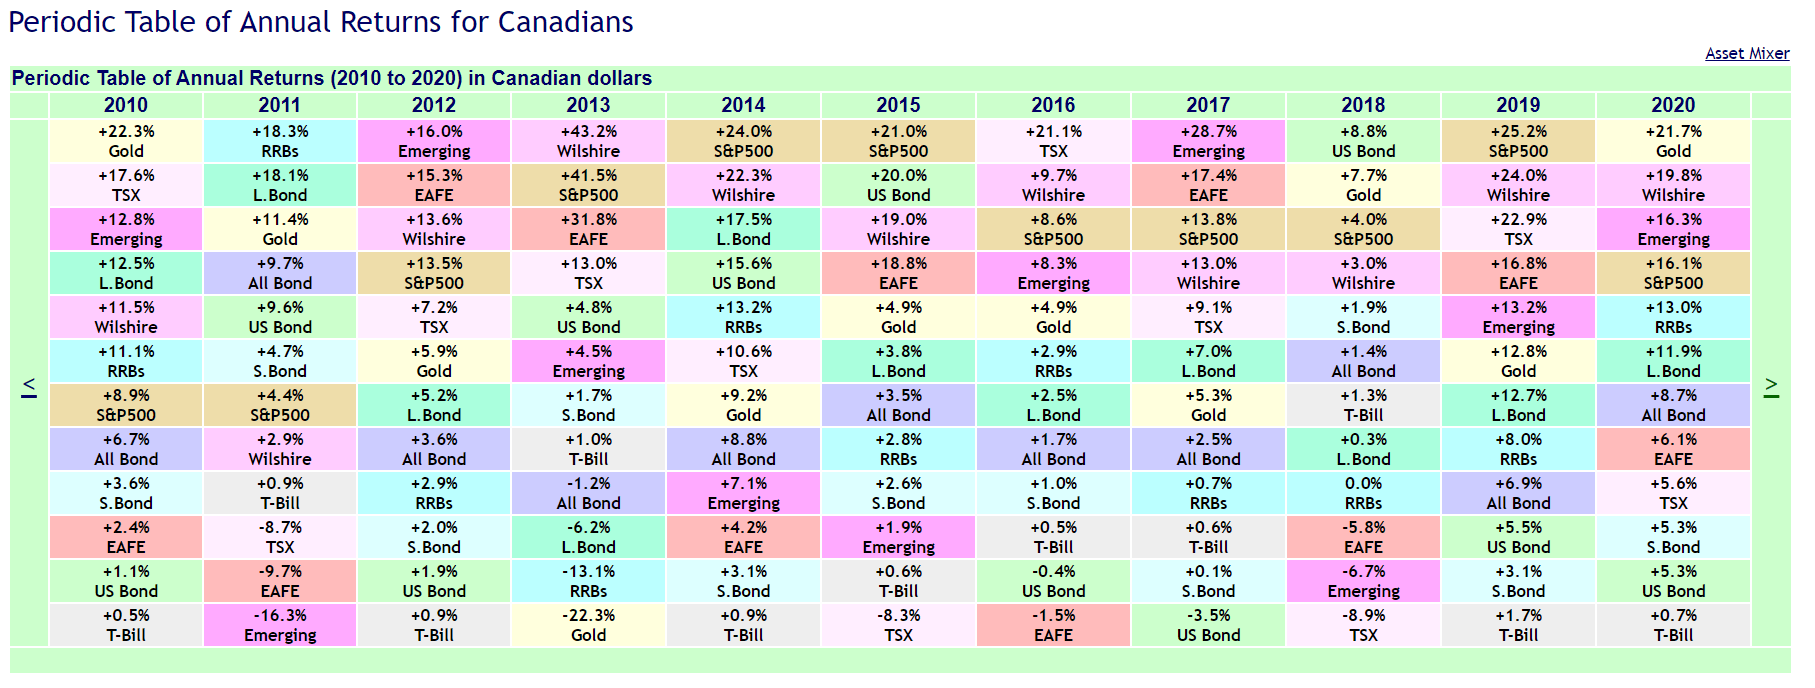
Quick Post: Three Industrial Gas Producers

The world leaders in Industrial gases specifically hydrogen are Linde(LIN), Air Liquide(AIQUY) and Air Products and Chemicals(APD). In addition to hydrogen and other gases, they also produce oxygen which is in high demand during this pandemic. For instance, Linde is major supplier of oxygen in many emerging countries. With millions of Coronavirus patients requiring oxygen the demand is exceeding supply in some countries.

With that said, all three stocks had great run this year until recently when they fell some after reporting earnings. The following chart shows the year-to-date returns of the three stocks:

Click to enlarge


Source: Yahoo Finance

Below is a brief excerpt from a journal article:

Linde, Air Liquide and Air Products have advantages over newcomers. Hydrogen is very volatile, and they already know how to safely produce, store and transport it. Their current industrial customers are also likely to be hydrogen buyers in the future and they have been investing in clean hydrogen pilot projects and new technologies.

Linde is the global leader after the German company merged with U.S. rival Praxair in 2018. It only funds hydrogen projects that provide double-digit internal rates of return, just like its other investments. Its joint venture with ITM Power also provides a link to promising electrolyzer technology used to make carbon-free, or green, hydrogen.

Air Liquide also takes a relatively conservative approach to hydrogen investment, focusing on the production and distribution of the gas, though it also dabbles in refueling stations. The Paris-headquartered company has a stake in electrolyzer company Hydrogenics, which has fuel-cell technology too.

Based in Allentown, Pa., Air Products and Chemicals has a bolder approach, investing in larger hydrogen projects with more experimental technologies. In July, the company announced it will contribute $3.7 billion to the $7 billion project to build a green-hydrogen facility in Neom, a futuristic megacity to be built in Saudi Arabia. Its stock has outperformed its peers this year, perhaps because it has absorbed more of the hydrogen hype. The gas accounts for roughly 25% of its revenue, compared with around 10% for the larger European companies.

Source: The Industrial Giants That Could Get a Lift From Hydrogen. WSJ

Disclosure: No Positions

Know Your Risk During COVID-19: Infographic

Coronavirus cases are exploding in the U.S. For the first time since the pandemic began, new cases exceeded 160,000 yesterday according to NY Times. For more than a week now average daily cases have crossed the 100,000 mark.

Covid-19 has killed 242,787 Americans so far and the total case count is over 10.6 million.

The situation is so bad in the country that the French aid organization Doctors Without Borders is now opening in the U.S. According to CNN’s Dr.Sanjay Gupta:

 “Doctors Without Borders have come to the United States to do their work. They go to the hottest spots in the world, they look at the Earth and say where are we needed? Well, they’re needed here in the United States right now.”‘

Usually DWB provides medical relief in some of the poorest and third world countries of the world. People in the US and other developed countries donate funds to this charity in order to help people in the worst spots of the world. So DWB operating in the richest country in the world is indeed shocking ! The even bigger sad thing is that scare resources that are desperately needed in other countries are now being spent by the DWB in the US because the country failed to take care of itself in spite of all the wealth.

Here is Dr.Gupta from another piece at CNN:

“This is a humanitarian disaster — probably one of the worst stories I’ve covered in my career here at CNN,” the network’s Chief Medical Correspondent Dr. Sanjay Gupta said Thursday.

With that brief update on the Coronavirus pandemic, below is an informative chart I recently came across. This chart shows the type of various day to-day activities that are low risk to high risk. Some of the high risk activities are going to a bar, working out at a gym, going to an amusement park, etc.

Click to enlarge

Source: Texas Medical Association (TMA)

China’s Per Capita GDP Growth From 1949 To 2019: Infographic

The economy of China has grown significantly in the past few decades especially after the country entered the WTO in 2001. From 1949 thru 1980 the GDP per capita was mostly flat. To put it another way, China’s economy took off under the leadership of Deng Xiaoping. The following infographics shows some of the key events since 1949 under each president and the per capital GDP growth until 2019:

Click to enlarge

Source: Unknown (Will update once identified)

Foreign Equity Markets: Less Concentrated and More Opportunities

In a recent post I mentioned that US stocks beat foreign stocks hands down over the long term. However that does mean one should simply avoid foreign stocks. In addition to diversification benefits, currently international equity markets are less concentrated than US markets and also they offer plenty of choices relative to the US market. The following chart shows how concentrated the US equity market is compared to international markets:

Click to enlarge

Source: Six charts that make the case for international equities and value, Schroders

An excerpt from the above article:

Picking up point 5, the narrow breadth of the US market has been a feature of the past few years. This has been mainly due to the phenomenal success of the US tech giants.

The chart below shows how the top five US stocks alone now make up almost one quarter of the S&P 500 index. By contrast, the top five international stocks account for just 7% of the international benchmark (MSCI World ex US).

This reflects a period of extraordinary growth for those tech giants. Aside from Microsoft, most of them were barely a twinkle in their founders’ eyes at the turn of the 21st century. There’s no denying that, so far, there has been no good time to bet against their success continuing. But this does raise the question how much further this trend can go on.

As we’ve already said, it’s impossible to predict an optimal time to diversify portfolios. However, this level of concentration in US markets suggests to us that now is probably not the worst time to do so at least.

Another perspective on the concentration in the US equity market can be found in the S&P 500. As of Oct 30th, IT constitutes over 27% of the index as shown in the following chart:

Click to enlarge

Source: S&P

In addition, six of the top 10 companies in the index are tech companies:

Source: S&P

Related ETF:

  • SPDR S&P 500 ETF (SPY)

Disclosure: No positions