The Retirement Age varies between countries. The general retirement age in the European Union is 65. In Spain, France and Germany the retirement age is set to increase to 67 years from 65 according to an article at The Finnish Center for Pensions. Some countries have different retirement ages for men and women. For instance, in Switzerland the retirement ages for men and women are 65 and 64 respectively while in Russia, it is 61.5 years and 56.5 years respectively. In the US, both men and women have a retirement age of 66 years and 2 months.
The chart below shows the retirement age in select countries:
Click to enlarge
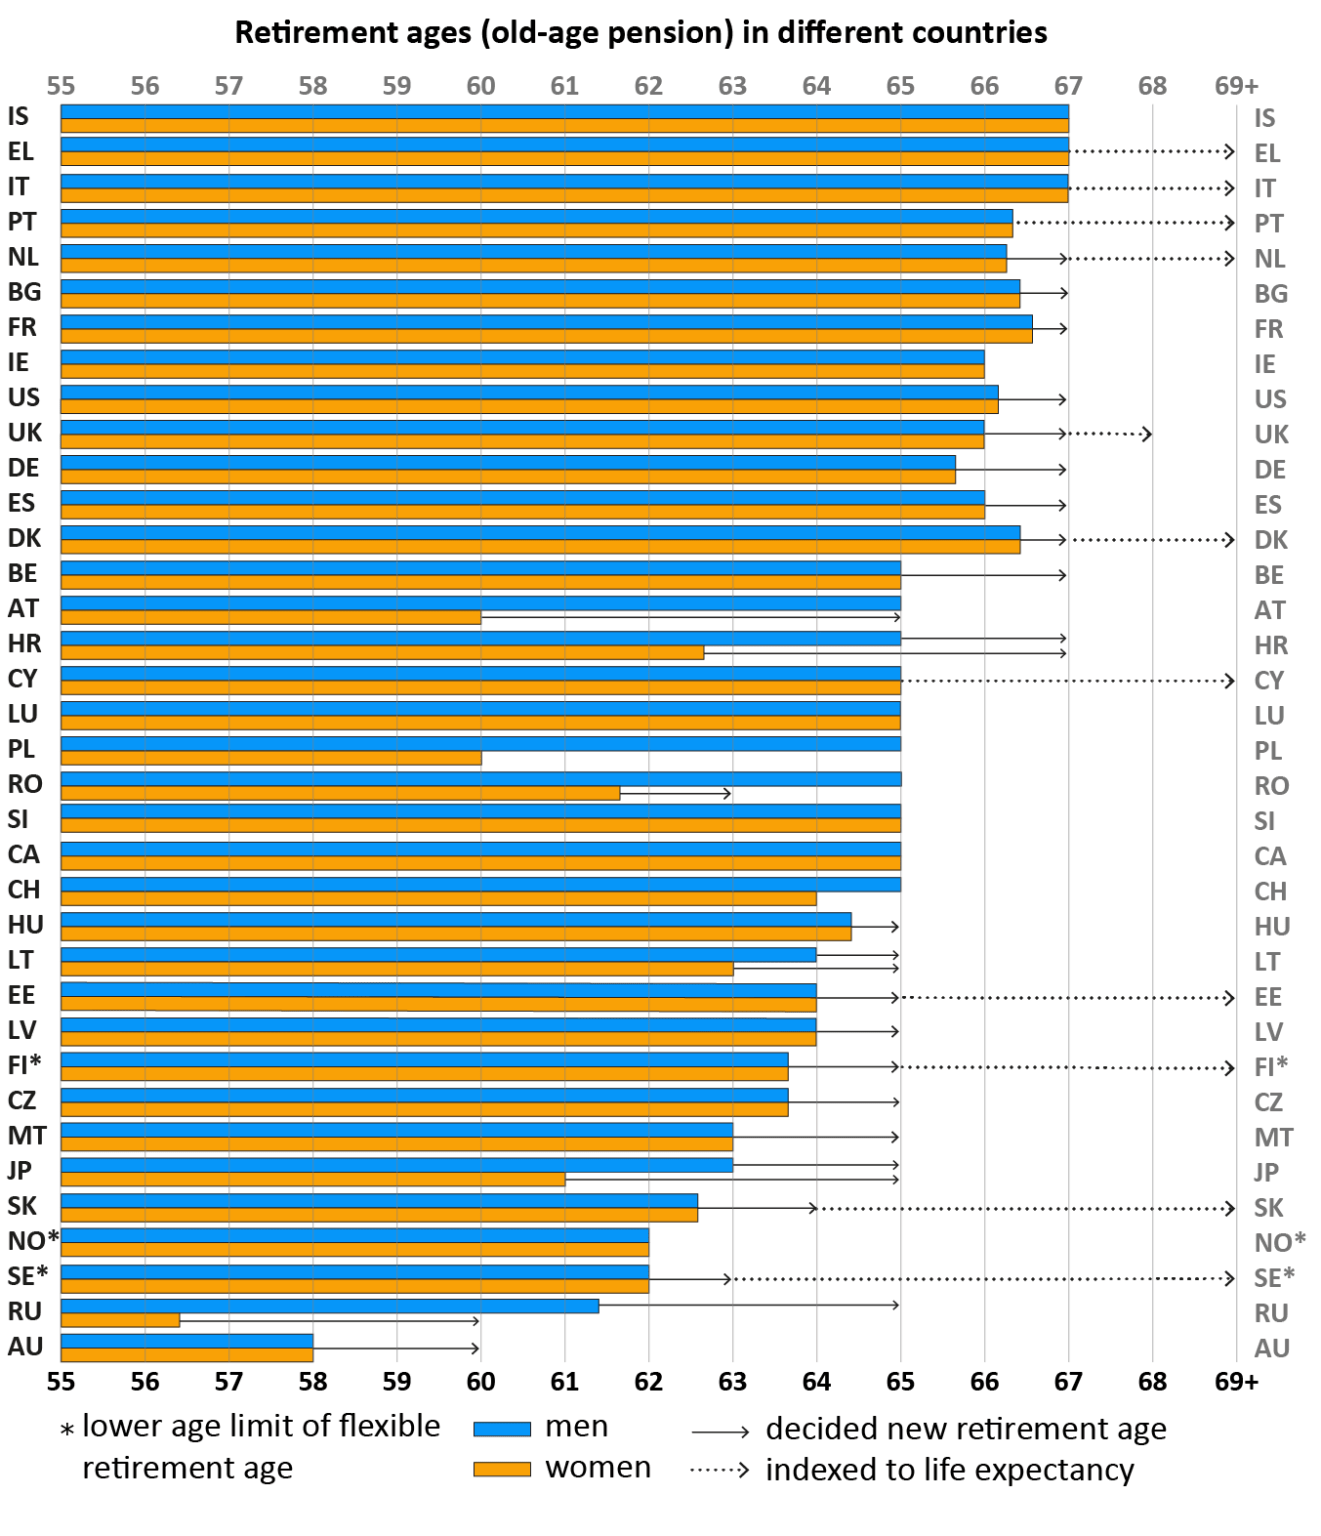
Source: Retirement Ages, The Finnish Center for Pensions
The Current Retirement Ages (2021):
| Current general retirement age (2021) | Future retirement age | |
|---|---|---|
| EU | Men/ Women | Retirement age or men/women |
| Austria (AT) | 65 / 60 years | 65 years (2033) |
| Belgium (BE) | 65 years | 67 years (2030) |
| Bulgaria (BG) | 66 years and 8 months | 67 years (2023) |
| Croatia (HR) | 65 / 62 years 69 months | 67 years (2033) |
| Cyprus (CY) | 65 years | 65+ years (2023) |
| Czech (CZ) | 63 years and 10 months | 65 years (2036) |
| Denmark (DK) | 67 years; 66 years 6 months* | 67 years (2022); 68+ years (2030) |
| Estonia (EE) | 64 years | 65 years (2026) |
| 68+ (2027) | ||
| Finland (FI) | 63 years 9 months 68 years; 65 years* | 65+ years (2027); 65+ (2030) |
| France (FR) | 66 years and 7 months | 67 years (2023) |
| Germany (DE) | 65 years and 9 months | 67 (2031) |
| Great Britain (GBR) | 66 years | 68 (2046) |
| Greece (EL) | 67 years | 67+ years (2021) |
| Hungary (HU) | 65 years | |
| Ireland (IE) | 66 years | 68 years (2028) |
| Italy (IT) | 67 years | 67+ years (2022) |
| Latvia (LV) | 64 years | 65 years (2025) |
| Lithuania (LT) | 64 years 2 months / 63 years 4 months | 65 years (2026) |
| Luxembourg (LU) | 65 years | |
| Malta (MT) | 63 years | 65 years (2027) |
| Netherlands (NL) | 66 years 4 months | 67+ years (2025) |
| Poland (PL) | 65 years / 60 years | |
| Portugal (PT) | 66 years and 6 months | 66+ years (2016) |
| Romania (RO) | 65 years / 61 years 6 9 months | -/63 years (2030) |
| Slovakia (SK) | 62 years and 810 months | 64 years (2030) |
| Slovenia (SI) | 65 years | |
| Spain (ES) | 66 years | 67 years (2027) |
| Sweden (SE) | 62-68 years; 65 years* | 63-69 (2023), 63+ (2026); 66 (2023), 66+ (2026) |
| Other countries | Men / Women | Retirement age or men/women |
| Australia | 58 years; 66 years 6 months* | 60 years (2024); 67 years (2023)* |
| Canada (CA) | 65 years | |
| Iceland (IS) | 67 years | |
| Japan (JP) | 63 years / 61 years; 65* | 65 years (2025) / 65 years (2030); |
| Norway (NO) | 6275 years; 67 years* | |
| Russia (RU) | 61 years and 6 months / 56 years and 6 months | 65 years (2028); 60 (2028) |
| Switzerland (CH) | 65 years / 64 years | |
| USA (US) | 66 years 2 months | 67 years (2027) |
| * FI, SE, DK, NO, AU and JP: the retirement age of the earnings-related pension has been separated from that of the national pension with a semicolon. | GP= Government proposal or plan of equivalent administrative level | + = Retirement age rising along with the increasing life expectancy. |
Note: The table lists first the earnings-related retirement age, then the national retirement age if it deviates from the first. Men’s and women’s retirement ages are also listed, if they differ from each other.
Update (11/17/23):
Latest version:
1.Minimum Standard Retirement Age for Select Countries as of Jan 2023:
Click to enlarge
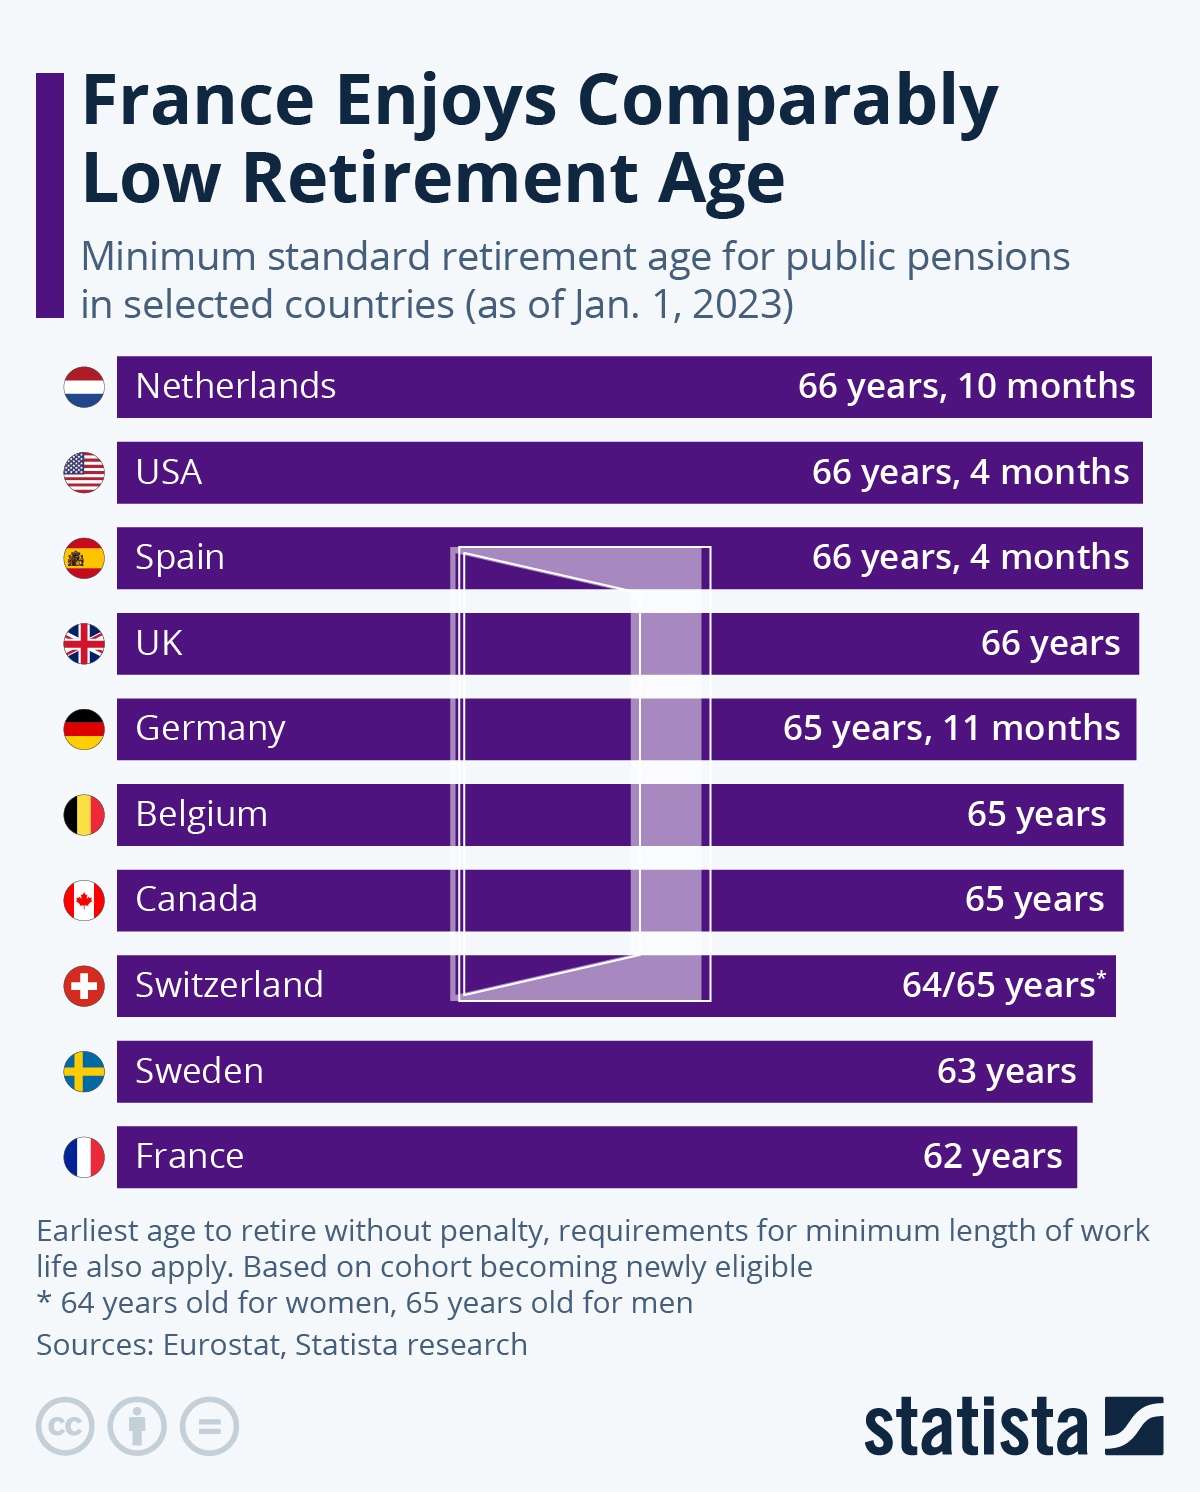
Source: France Enjoys Comparably Low Retirement Age, Statista
2. Ranked: The Best Countries to Retire in Around the World
Click to enlarge
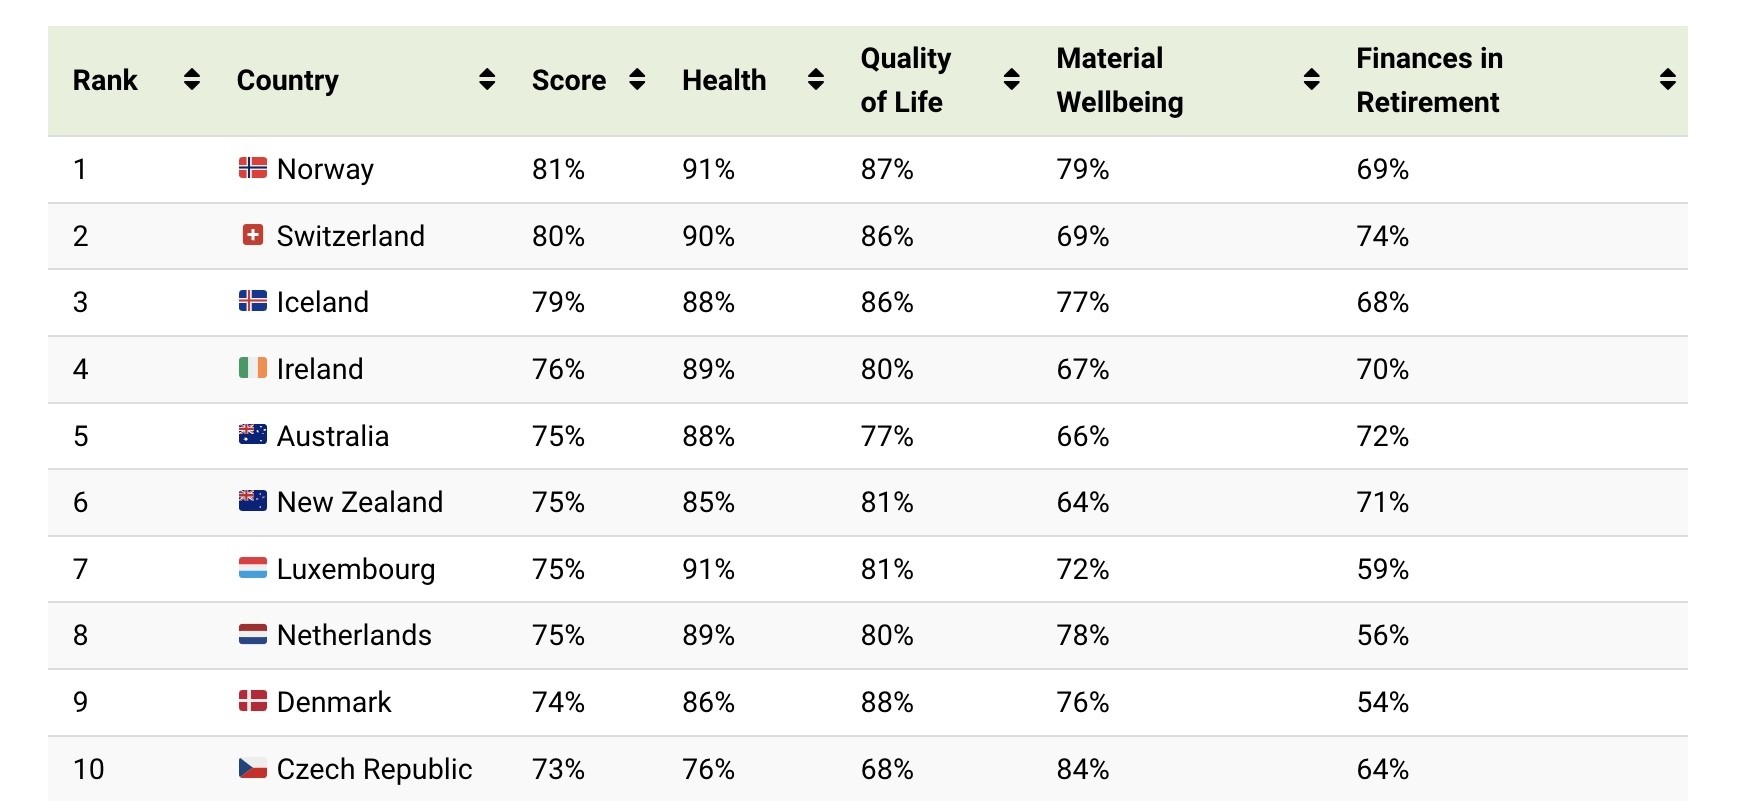
Source: WEF
3.Global Retirement Ages:
Click to enlarge
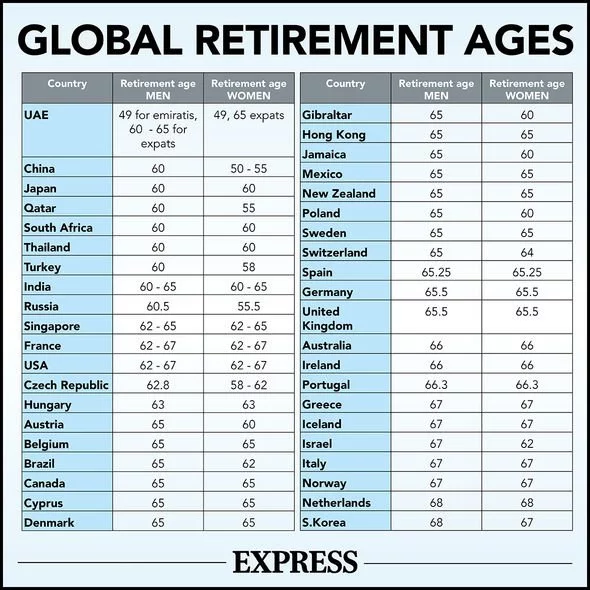
Source: How UK state pension age compares to retirement ages in other countries around the world, Express
Related Posts:
- From France To The U.S.: Pension Reforms And The Retirement Age Debate, US Funds
- Study: Social Security Is The Most Important Source Of Income For Senior Citizens
- How Does Social Security Payments in the US Compare to Other Developed Countries : Chart
- Social Security Payments Across OECD Countries: Chart
- Can European Countries Afford Liberal Pension Benefits ?
- Sources of Income for Senior Citizens In OECD Countries
- On The Retirement Plans By Country Across Europe
- The Global Retirement Landscape 2015
- Maximum State Pension and Pension Age in Select Countries
- Are You On Track For Retirement: Infographic
- Singapore Leads The World in Saving For Retirement
- Retirement Age for Men and Women in OECD Countries: Chart
- Current and Future Retirement Ages Around The World
- A Review of Retirement Age in OECD Countries