I came across this interesting financial planning steps in the form of the bingo game:
Click to enlarge
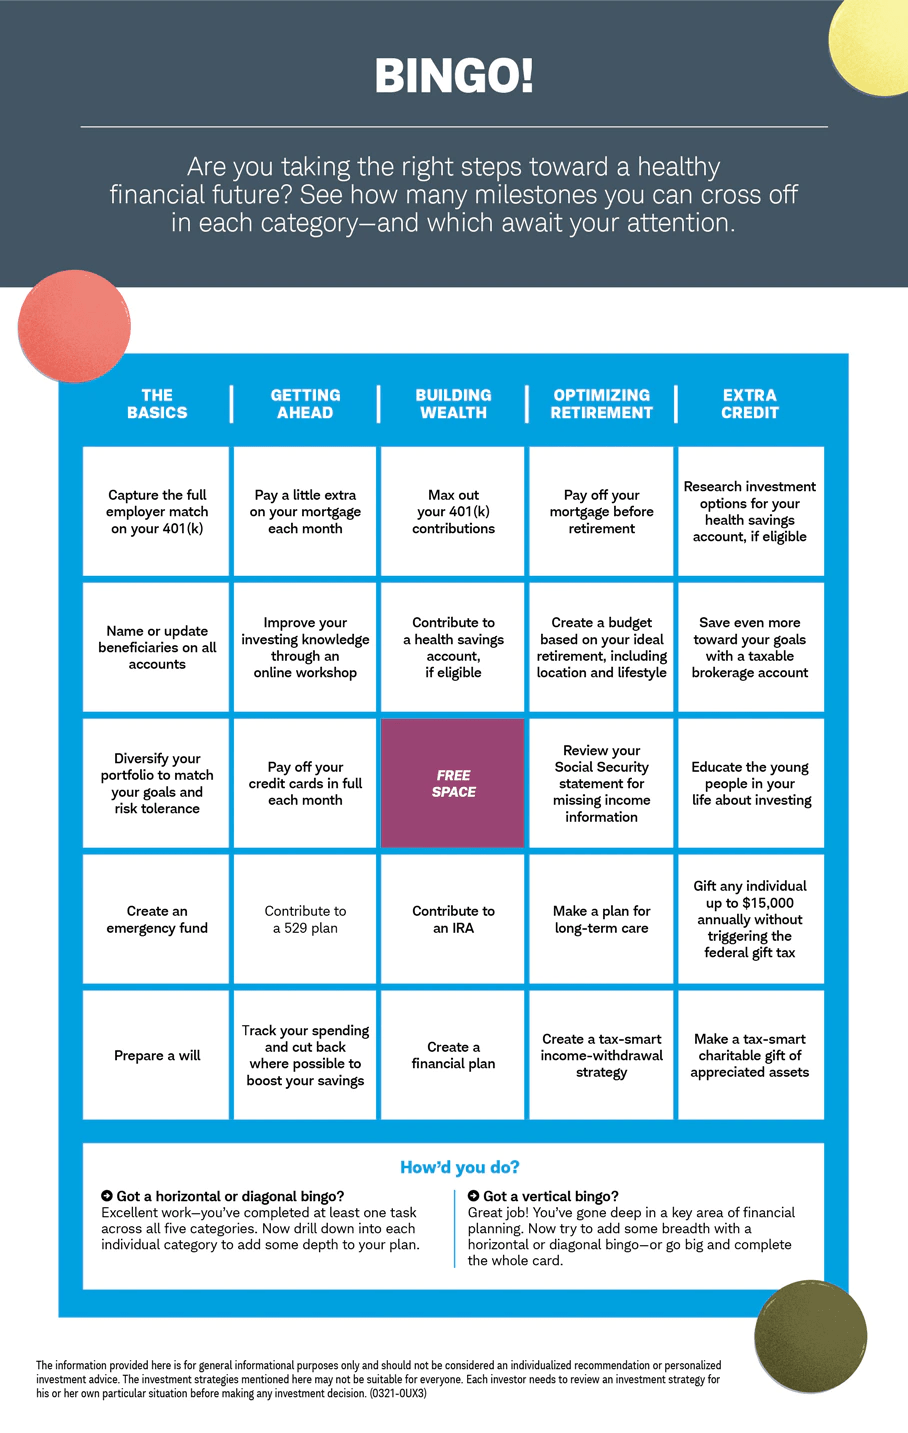
Source: Charles Schwab
I came across this interesting financial planning steps in the form of the bingo game:
Click to enlarge
Source: Charles Schwab
One of the best sectors to own for the long-term is the defense sector. Defense stocks tend to be like consumer staples stocks. They perform well in both good and bad times. One reason is that similar to food and other consumer staple goods, defense is a necessary and integral part of developed countries especially the major powers. From potential wars with adversarial countries to eliminating terrorists a strong and powerful defense industry is needed. Accordingly in countries such as the US, defense spending gets a substantial allocation in every budget. The defense industry is also a major source of employment for hundreds of thousands of workers. I have written a few articles over the years on investing in this industry including:
With that said, in a recent article Jeffrey Kleintop of Schwab discussed the defense sector as one of the best performing investment themes in the past few months. From the article:
Defense spending has not been favored in 2021 government budgets, but rising geopolitical tensions often inspire gains in this area of the market, so it’s worth taking a look at what might be causing the outperformance in recent months.
- Increasingly heated rhetoric and threats between nations, such as China-Taiwan, U.S.-Russia, Israel-Iran, may involve U.S. or its allies.
- Adversaries often use national elections and changes in administration to challenge and test foreign and domestic policy positions. The U.S. Biden administration hits the first 100 days in office milestone this week.
- Securing economic resources (COVID-19 vaccines, semiconductors, energy commodities) heightens the risk for armed conflict between nations.
The potential always exists for a geopolitical event to draw the U.S. and other major nations into armed conflict. While events are often unpredictable and the countries involved vary, the markets’ reactions to threats of armed conflict between nations have tended to be both broad-based and short-lived, averaging declines of 3% over an average of 7 days for two dozen involving military operations of the U.S. and allies since 1980. During periods of economic recovery and growth, the effects were more muted than during recessionary periods.
History shows that these overall market reactions have tended to be muted and brief. Furthermore, defense stocks have not been a consistent hedge against these military operations. Since the inception of the MSCI World Aerospace and Defense Index at the end of 1998, the nine events involving military actions saw defense stocks rise an average of only 0.1% on the day of the event and post a gain only about half of the time (during 5 of the 9 events).
If tensions ease, defense stocks outperformance may not be sustained. If they flare up, this investment theme may see volatility given the history of inconsistent performance. A long history of geopolitical developments shows holding a well-diversified portfolio may buffer against potential short-term market moves. Investors should avoid overreacting to geopolitical developments and stick to their long-term financial plans.
Source: What’s Working? Two Ideas For Investors by Jeffrey Kleintop, Charles Schwab
Some of the major defense stocks to consider are listed below:
Disclosure: No Positions
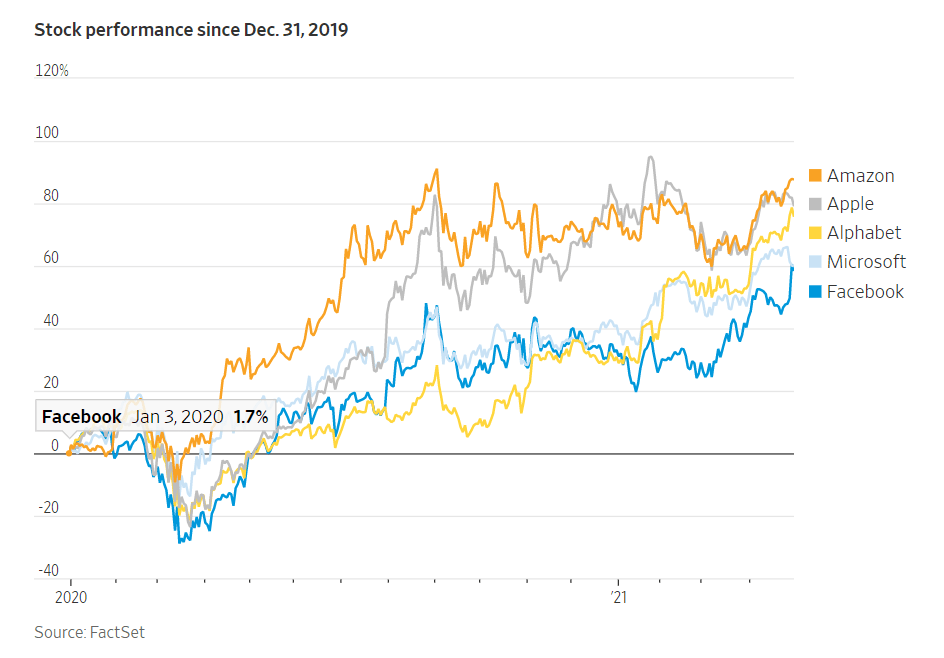
The top five tech companies – Amazon.com Inc (AMZN), Apple(AAPL), Alphabet(GOOG) and Facebook(FB)
Microsoft(MSFT) have enjoyed tremendous growth through the pandemic. Millions of people working from home and millions going online for shopping have helped these giants. The following charts shows the astonishing rise of these firms.
Stock price growth since Dec 31, 2019:
Click to enlarge
Market caps of the top five tech stocks have grown year-after-year. The combined market value of these companies has reached over $8.0 Trillion. This amounts to about a quarter of the market value of the S&P 500.
Click to enlarge
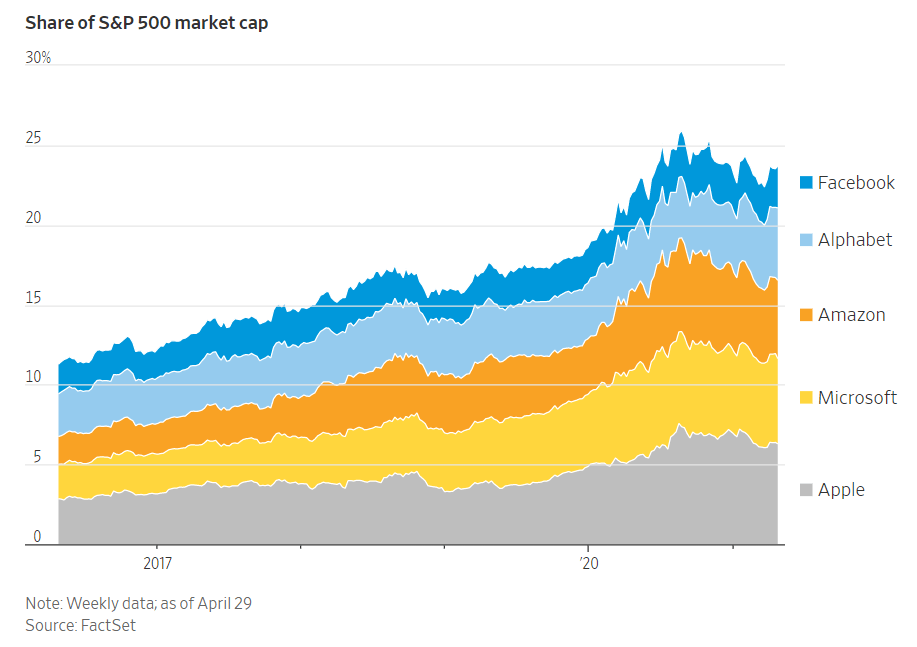
Source: WSJ
Disclosure: No Positions
The Wufengshan Yangtze River Bridge is a double deck suspension bridge across the Yangtze river in China. It carries an eight-lane expressway and a high-speed rail line. In fact, it is the world’s largest hi-speed railway bridge. This bridge was opened to traffic in Dec, 2020.
The following is a cool video of this engineering marvel:
Source: You Tube
In the US, states and local governments collected $1,303 per capita in individual income taxes for fiscal year 2018 according to Tax Foundation. However tax collections vary widely between the states as shown in the chart below.
The states with top per capita tax collections are: New York, the District of Columbia, Connecticut, Maryland, California and Massachusetts. And the states with the lowest per capita tax collections were North Dakota, New Mexico, Mississippi, Arizona and Louisiana.
Click to enlarge

Source: State and Local Individual Income Tax Collections Per Capita, Tax Foundation