Dividend yields of equity markets are generally higher in countries of the US. This is true especially in developed Europe where the dividend culture is more traditional and deep-rooted. Some emerging markets also offer attractive dividend yields. For income investors based in the US, the smart strategy is identify these opportunities abroad and spread their assets across countries and industries to capture higher yields. Currently the S&P 500 has a dividend yield of 1.38%. Certain sectors such as utilities, consumer staples, etc. offer higher yields around 3% or so. However the maximum yields of these sectors is still lower than yields in some developed markets such as Australia, Singapore and UK for example. Even with any applicable dividend withholding taxes, ADR fees, foreign exchange impacts, etc. it is possible to earn higher yields than in the US.
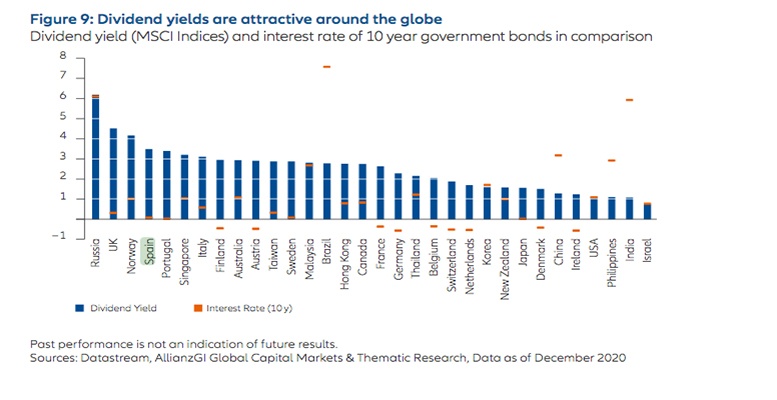
The following chart shows the MSCI dividend yields for select countries and the interest rates on 10-year government bond as of Dec, 2020:
Click to enlarge
Source: Alliance Global Investors Dividend Report 2021 via the Corner
Among the developed European countries, traditional dividend champion UK is at the top followed Norway. Spain is projected to the top dividend payer this year. Of the BRIC countries, Russia has the highest yield while India has the lowest. As noted earlier Singapore is also far ahead of many other countries including neighboring Malaysia. In the beginning of 2021, the US dividend yield based on MSCI indices stood between Ireland and Philippines.
With that said, investors looking for foreign dividend stocks can consider the following options for further research and investment:
1.Company: National Grid PLC (NGG)
Current Dividend Yield: 8.46%
Sector: Multi-Utilities
Country: UK
2.Company:Commonwealth Bank of Australia (CMWAY)
Current Dividend Yield: 2.40$
Sector: Banking
Country: Australia
3.Company: Westpac Banking Corp (WBK)
Current Dividend Yield: 3.42%
Sector: Banking
Country: Australia
4.Company: Enbridge Inc. (ENB)
Current Dividend Yield: 6.93%
Sector: Oil & Gas
Country: Canada
5.Company: DBS Group Holdings Ltd(DBSDY)
Current Dividend Yield: 2.46%
Sector: Banking
Country: Singapore
6.Company: Eni SpA (E)
Current Dividend Yield: 3.57%
Sector: Oil and Gas
Country: Italy
7.Company: TELUS Corp (TU)
Current Dividend Yield: 4.70%
Sector: Telecom
Country: Canada
8.Company: TotalEnergies SE (TTE)
Current Dividend Yield:
Sector: Oil, Gas & Consumable Fuels
Country: France
9.Company: NK Lukoil PAO(LUKOY)
Current Dividend Yield: 9.41%
Sector: Oil & Gas – Integrated
Country: Russia
10.Company: Unilever PLC (UL)
Current Dividend Yield: 3.33%
Sector: Food Products
Country: UK
Disclosure: Long WBK