S&P 500 Total Return vs. Price Return: Chart

Dividends are important factor to consider to boost return with equity investments. I have written many times before in this blog that dividends provide a cushion to a well-diversified portfolio during adverse market conditions and help increase the total return of an investment. To put it another way, buying dividend-paying stocks and then reinvesting the dividends will lead to higher total return especially in the long run in most cases. In rare situations one can lose both the principal and the reinvested dividends if a company goes bankrupt. During the Global Financial Crisis of 2008-09 many investors lost big following this strategy when banks failed and equity became worthless. However things like the GFC are not frequent enough to avoid this concept entirely.

From January, 2000 to June, 2020 S&P 500 has soared by 700% based on total returns (dividend reinvested).  This is 43% higher than price returns only. The power of compounding over many years led to a solid 43% excess return.
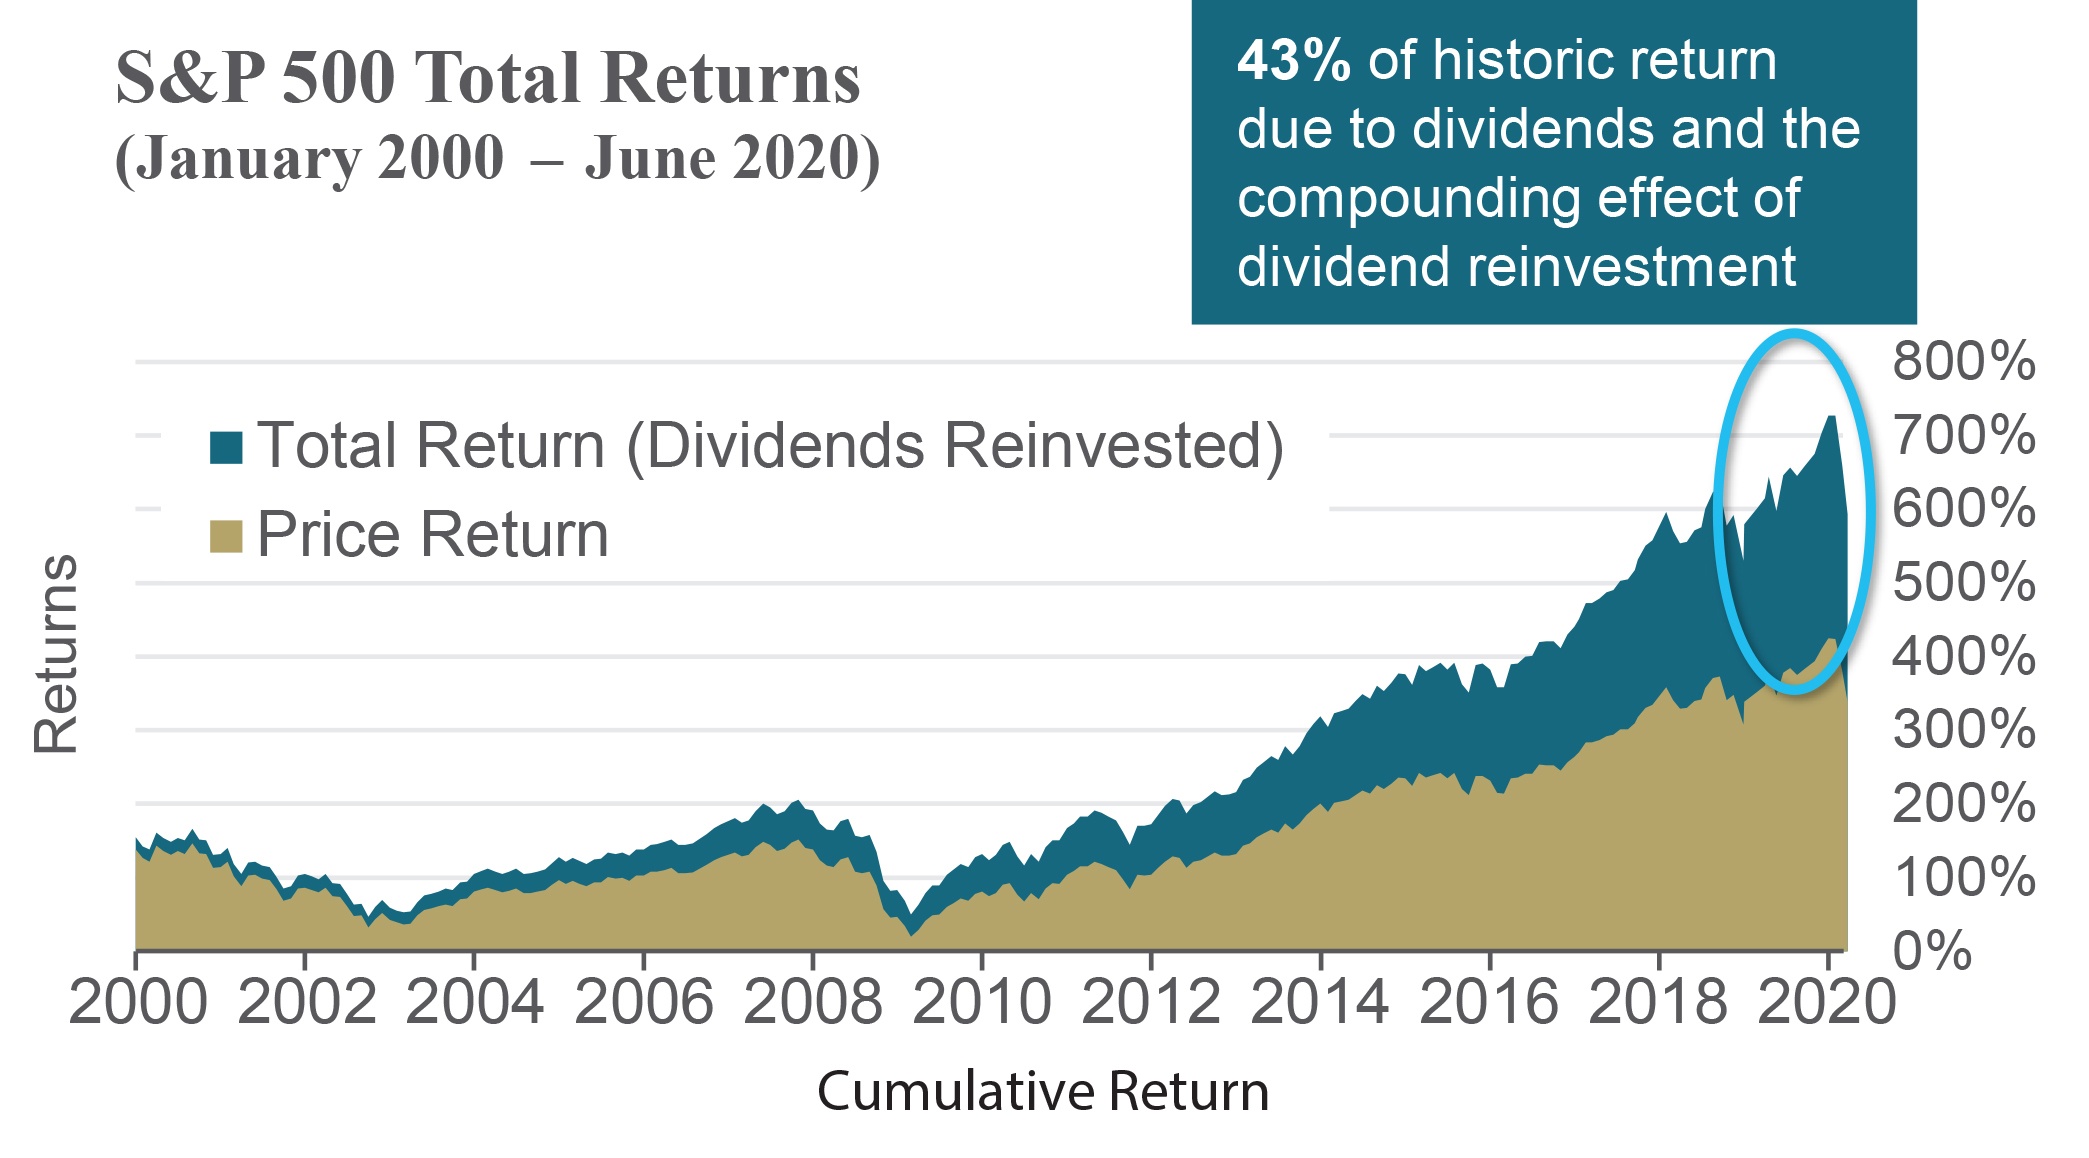
Sources: FactSet, Mellon Investments Corporation June 30, 2020. Past performance is no guarantee of future results. Charts provided are for illustrative purposes only and not indicative of the past of future performance of any BNY Mellon product.

Source: Equity income investing: A strategy for unpredictable markets, BNY Mellon

Related ETF:

  • SPDR S&P 500 ETF (SPY)

Disclosure: No Positions
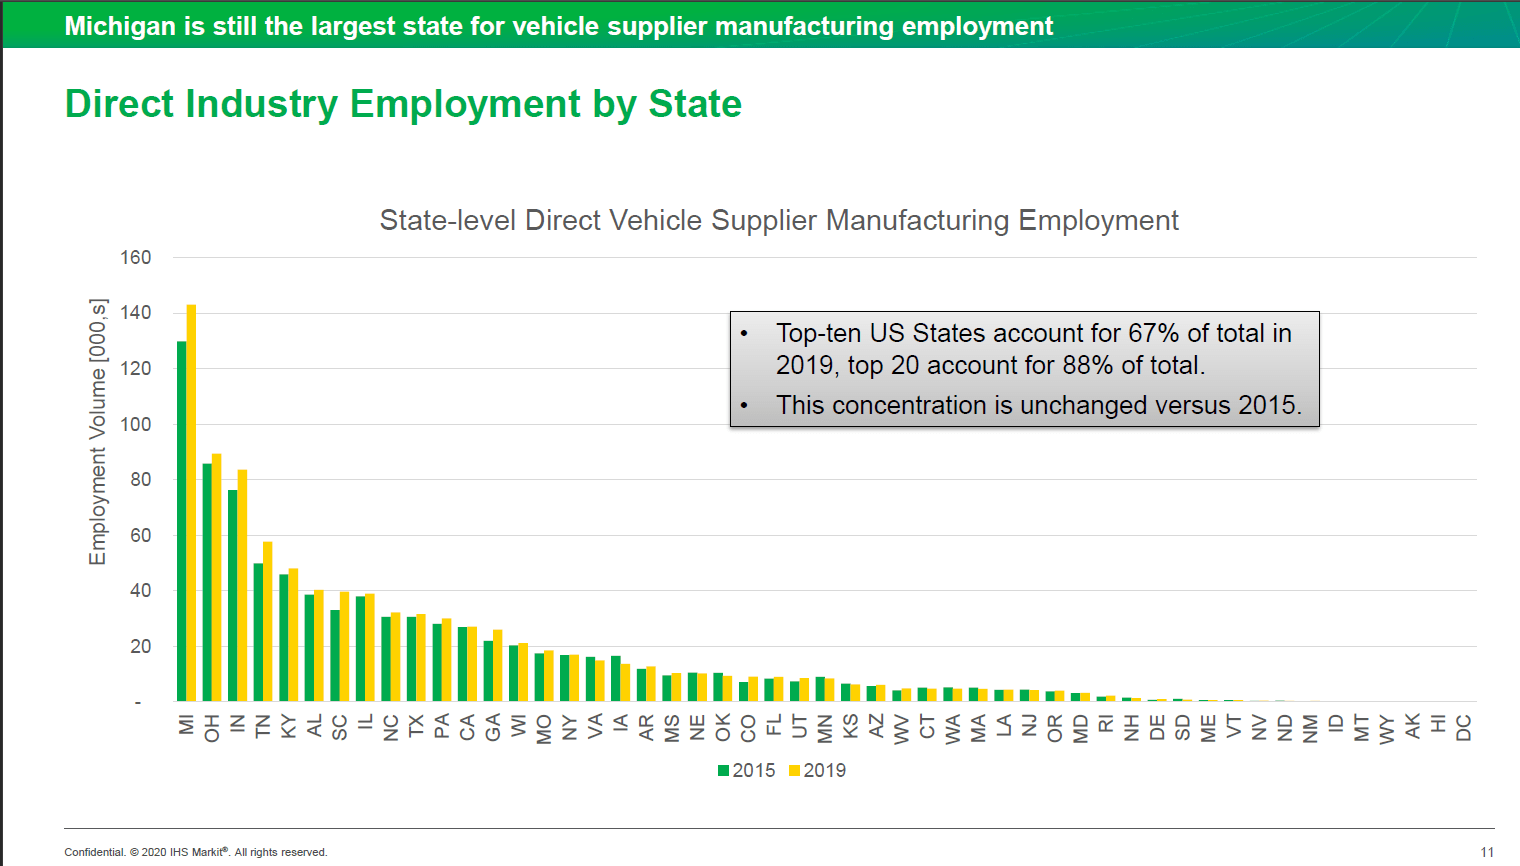
US Direct Auto Supplier Manufacturing Employment by State: Chart

The US auto parts industry is the second most important industry after the auto manufacturing industry. Direct employment by auto parts suppliers was over 907,000 in 2019. When indirect jobs are included the total reached out 4.8 million jobs in that year according to a report by Motor & Equipment Manufacturers Association.

Mid-western states have the largest auto parts employment with Michigan as the top state for auto parts supplier employment followed by Ohio and Indiana. The top 10 states accounted for 67% of total direct employment and the top account for 88% of the total. Obviously Alaska and Hawaii rank the last in auto parts employment.

Click to enlarge


SourceUS Labor & Economic Impact of Vehicle Supplier Industry 2019CY Final Report for Motor & Equipment Manufacturers Association, December 2020 2.0, MEMA

In a future post we will look at the auto parts employment figures in Mexico.

Related lists:

On The Impact of Inflation on Equity Returns – An Australian Example

Inflation has become one of the main topics in the US media in recent weeks. Prices of autos to food and restaurant meals are going up to the surprise of the general population which generally was protected from the ravages of inflation for many years now. Curious investors are wondering about the impact of inflation on equity returns. While it is well known that stocks traditionally yield a return that beats inflation, it is still important how stock returns are affected during different phases of inflation.

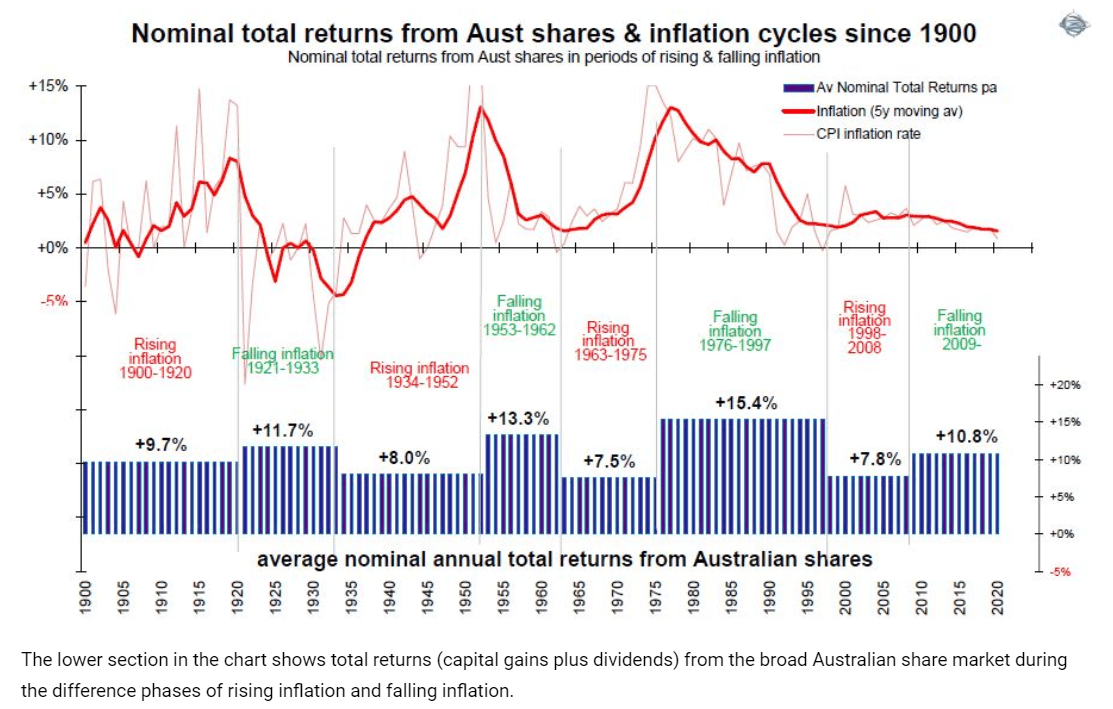
I recently came across an excellent piece at Firstlinks that discussed the very topic from an Australian perspective. The gist of the article is during rising inflation periods, equity returns decline. But during periods of falling inflation, equity return increases as shown in the chart below:

Click to enlarge

Source: How inflation impacts different types of investments, Ashley Owen, Firstlinks, Australia

It should be noted that the returns shown above are not adjusted for inflation. So the total return of 7.8% during the rising inflation period of 1998 to 2008 is lesser when accounted for inflation. The “real” return during that period was just 4.3%.

The key takeaway is investors can expect to earn lower returns from equities during periods of rising inflation and vice versa. As the US is in the rising phase of inflation cycle currently equity returns would be lower not higher in the future.

Related ETFs:

  • iShares MSCI Australia Index Fund (EWA)
  • SPDR S&P 500 ETF (SPY)

Disclosure: No positions

Performance of Gold vs. S&P 500 During Major Crises

Gold is an important asset class to own in a well diversified portfolio. The performance of gold is negatively co-related to risky assets such as the S&P 500. In this post, let’s review the return of gold vs. the S&P 500 during major crises in the past few decades.

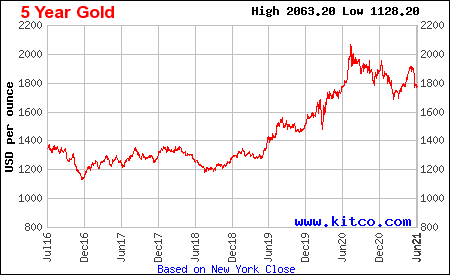
Before we get to that a quick note on the price of gold. Gold topped out at over $2,000 during the pandemic last year. This year gold has been an average performer so far. Yesterday gold prices closed at $1,775.00 an ounce. From a historical perspective, gold has returned 516% since 2000.

Click to enlarge

Source: Kitco

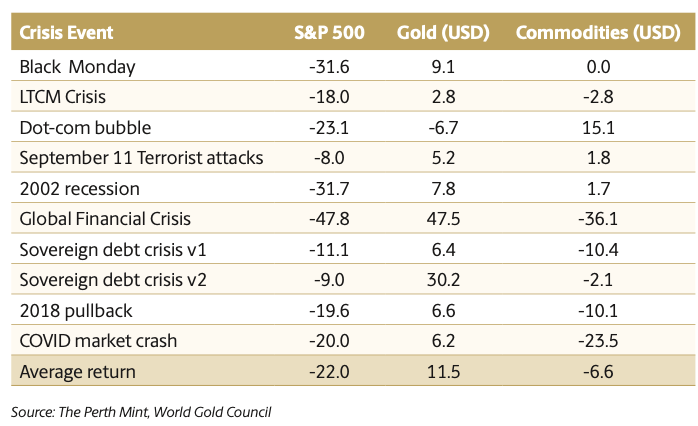
As mentioned above, gold tends to have strong growth when stock prices decline and vice versa. This is because gold is considered a safe haven asset and as investors flee from risky stocks they try to take shelter in gold. In addition, gold is traditionally regarded as good source for holding value. So when the world is engulfed in major crisis gold attracts hordes of investors. For example, during the Covid crash of 2020 S&P 500 plunged 20%. But gold was a winner with just over 6% gain. The case for gold was even more pronounced during the Global Financial Crisis when stocks crashed by about 48% and gold rose over 47%.

Click to enlarge


Source: The case for a modest allocation to gold in super funds by Jordan Eliseo, First Links, Australia

The key takeaway is gold can cushion a portfolio when equities fall. So it is wise to allocate some portion of assets to gold.

Related ETF:

  •  SPDR Gold Trust (GLD)

Disclosure: No Positions

European Companies That Have Increased Dividends For More Than 20 Years

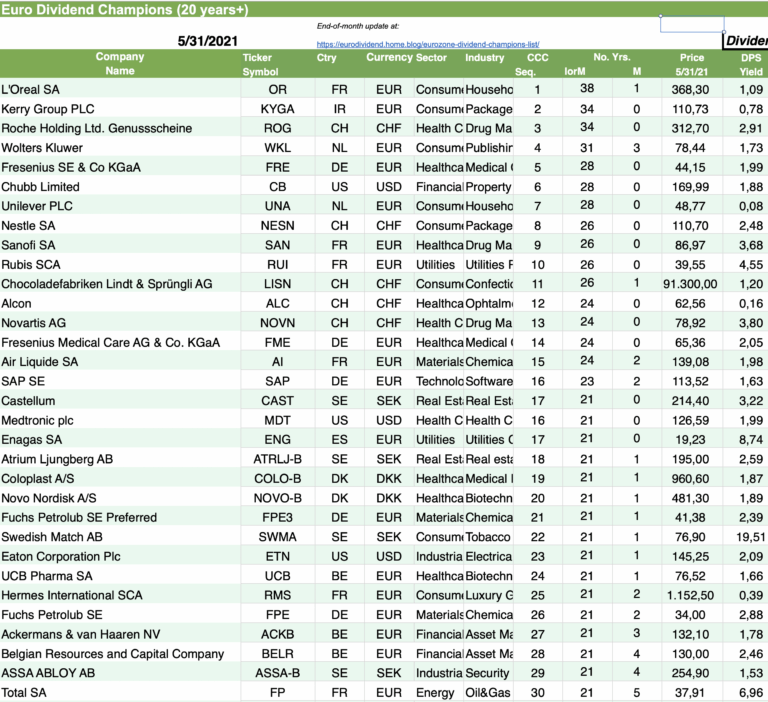
The S&P 500 Dividend Aristocrats measures the performance of companies that have increased for 25 consecutive years. Similar to these US Dividend Aristocrats there are many European firms that are consistent dividend growers. In this post, let us take a look at companies from Europe that have raised dividends for 20 years or more. For investors that are interested in the European Dividend Aristocrats, the S&P Europe 350® Dividend Aristocrats® measures the performance of companies in the S&P Europe 350 index that have increased the dividend payments for at least 10 consecutive years.

Click to enlarge


Source:DRIPInvesting.org via Tim Schaefer

A few observations:

  • France-based, cosmetic giant L’Oréal S.A. (LRLCY) has increased dividends for 38 years ! Currently the ADR has a market cap of over $255.0 billion and the stock has a dividend yield of 1.99%. L’Oreal stockholders that own the stock for more than two years can receive a 10% loyalty bonus dividend as well.
  • Swiss pharmaceutical leader Roche Holding AG (RHHBY) currently pays a 2.57% dividend. Roche has raised dividends for 34 years.
  • Other drug firms in the above list include Fresenius Medical Care AG & Co (FMS), Novartis AG (NVS) and Novo Nordisk A/S (NVO).
  • Unilever PLC (UL) and Nestle SA (NSRGY) in the consumer staples sector have increased their dividend payments for 28 and 26 years respectively.

A Note on Dividend Withholding Tax:

Dividend withholding taxes for US residents will reduce the actual yield reported above. This tax for foreigners varies by county and can be as high as 35% in the case of Switzerland. The full list of rates by country can be found here.

Disclosure: No Positions