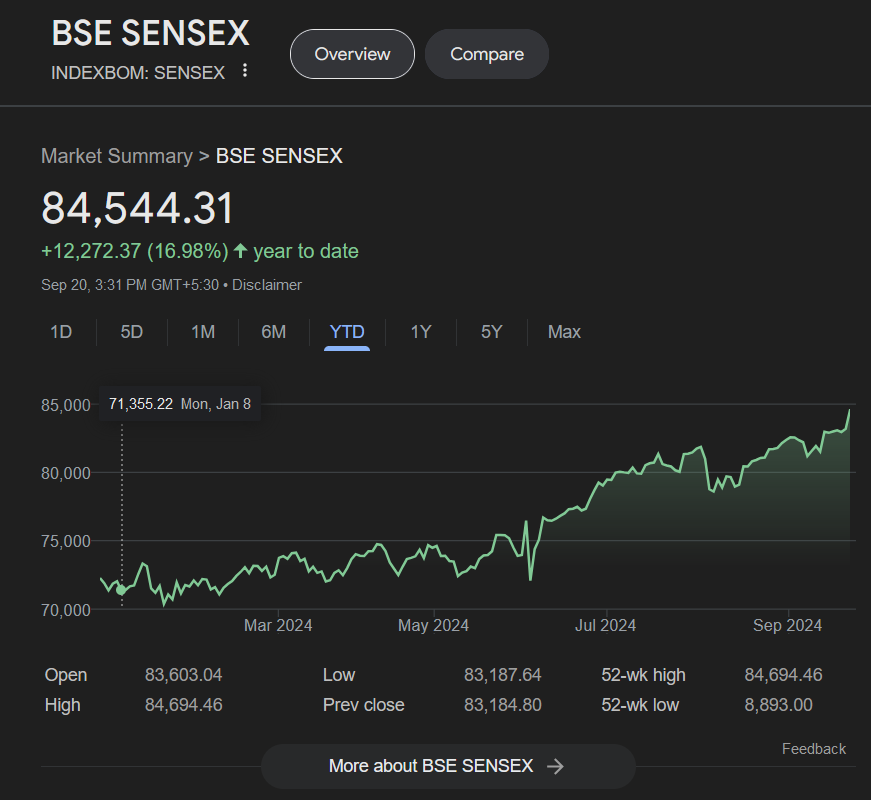
Indian equity markets reached yet another all-time record high this Friday. The benchmark Sensex index reached a high of 84,694 and ended the day at 84,544 with an year-to-date return of 17%. In the past 5 years, the index has more than doubled. Sensex’s return so far this year puts it among the top four global indices as shown in the chart below. Only the NASDAQ and S&P 500 are ahead of the Sensex.European indices such as the DAX and CAC are lagging the amazing returns of the US and Indian markets.
Click to enlarge
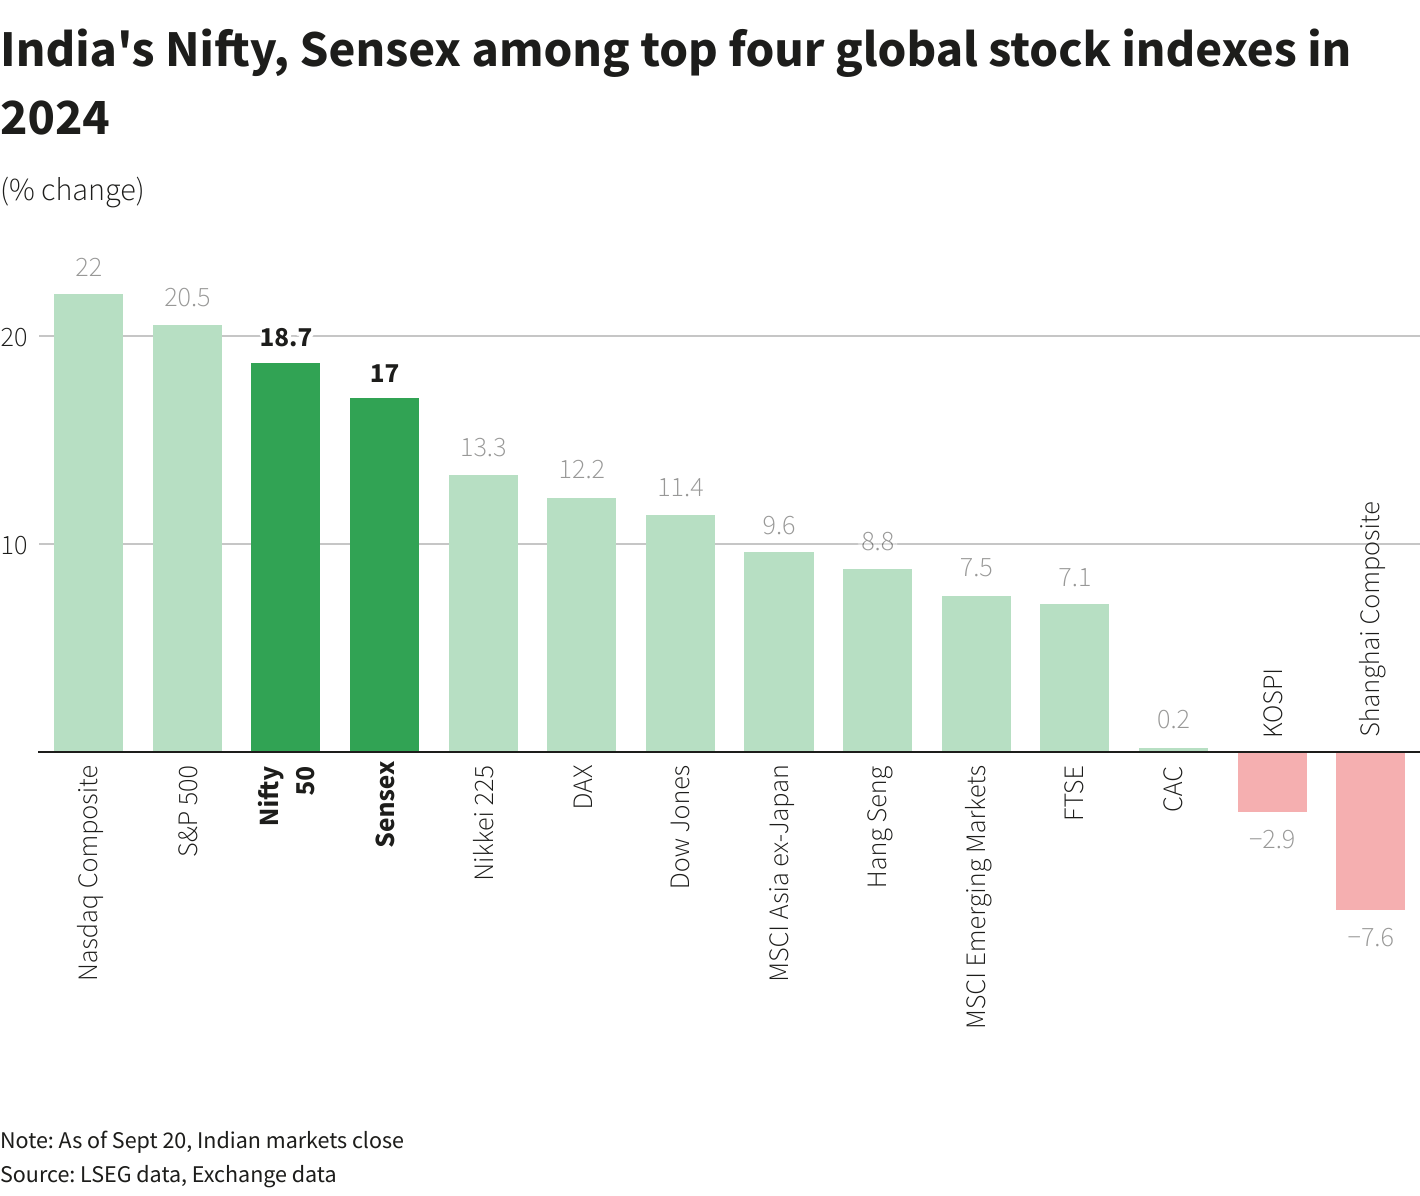
Source: India’s Nifty, Sensex outperform most global markets, behind only Wall Street, Reuters
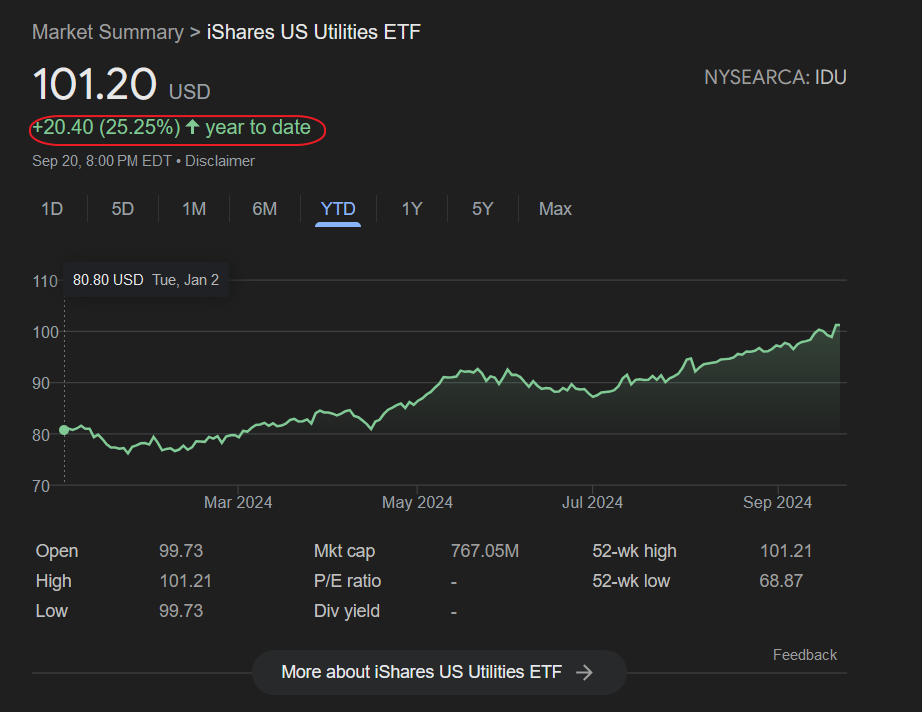
The following chart shows the YTD and 5-year price return of the Sensex:
Year-to-date return:
Click to enlarge
5-Year return:
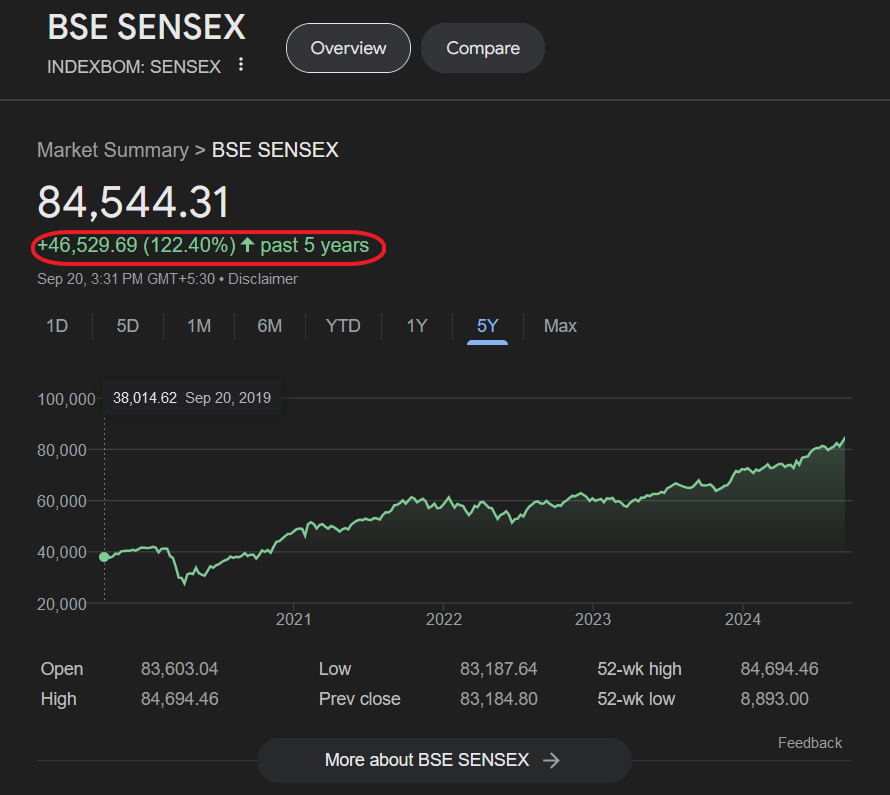
Source: Google Finance
At current levels, the P/E ratio on the Sensex is 23.99 according to Exchange data. Indian stocks are richly valued though the ratio is less than the figure reached in 2021-22. Should the US economy enter a recession, global equities including emerging markets like the Indian market would be adversely impacted.
For additional historical data and charts on Sensex annual returns go here.
Related ETFs and ETNs:
Disclosure: No positions