Success with investing in stocks requires more than following simple concepts such as Buy and Hold, Dividend Growth Investing, Buy Low and Sell High, Momentum chasing, etc. it requires more than anything picking the rights stocks or to be more precise – picking the winners than losers. This is because if an investor picks randomly picks let’s say 25 stocks and following the buy and hold strategy holds them for 20 years it is perfectly possible that this investor may earn an average return or even have a loss – if most of the stocks do not perform well. Even worse if most of them are duds in the entire period of owning for 2 decades the investor may lost money.
With that brief intro, I came across an article recently that noted that most of the wealth created by the US-listed companies in the past 90 years came from just 4% of them. This means the other 96% of them were poor or average performers. From the article:
Long-term investors might be surprised to find that a typical stock listed in the US from 1926 to 2019 had a buy-and-hold return of -2.8% over its entire lifetime. In an international context, from 1990 to 2018 the typical buy-and-hold return of a stock was -14.9%. This means that if an investor had picked a stock randomly, the most likely outcome would have been a loss of capital.
How is it possible then that the typical stock has a negative return but the average return of the market is 8% over the last 100 years? This discrepancy exists because the distribution of equity returns is skewed. Stock market returns are positive and higher than the return of the typical stock thanks to a relatively small group of stocks producing exceptional returns.
Exactly how exceptional was recently shown in a study by Professor Hendrik Bessembinder from Arizona State University, who calculated that just 4% of companies listed in the US were responsible for all wealth creation in the past 90 years. This shows that indiscriminate stock picking has very little chance of success. Investors need to find ways to improve theirs odds of selecting those companies that are not typical and belong to the small group of winning stocks.
We believe the concept of unanticipated economic profit, embedded in a trends-focused investment process, significantly improves these odds. Markets are largely efficient and reflect the aggregate expectations of all participants in the pricing of equities. Only when reality consistently exceeds or undershoots these expectations can we expect to see extraordinary long-term equity returns. Unanticipated economic profit is therefore crucial to finding the winners.
Not all industries are created equal
The small group of stocks that have created the majority of the wealth includes household names such as Apple, Microsoft and Amazon. Outside the US, stocks that have produced a disproportional amount of wealth are Tencent, Nestlé and Samsung.
At the industry level, we observe that relative profitability tends to remain steady over long intervals for most industries. Prosperous industries stay prosperous and poor industries stay poor. The emergence of new trends or disruptive innovations might cause long-term tail or headwinds for industries. In technology, the rise of the internet brought tremendous success for streaming services, and sounded the knell for physical video rental stores such as Blockbuster.
Greater disparities emerge by going back further, using the timeframe of 1926-2019. The software industry created USD 4.1 trillion in wealth for investors since its birth in the 1960s until now. On the other hand, the precious metals industry destroyed USD 17 billion in wealth. The contributions made by different industries is shown in the graphic below:
Wealth Creation by Industry in US from 1926 to 2019:
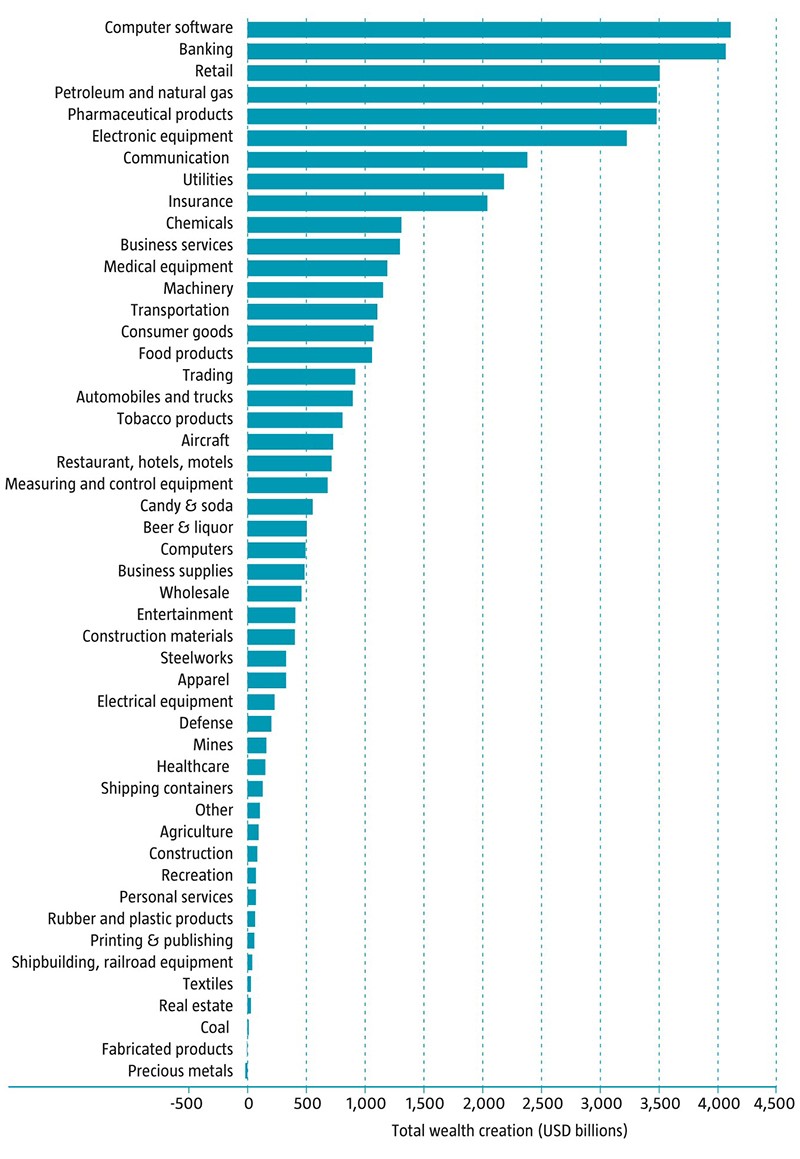
Source: CRSP, Robeco. Market: US. Time period: 1926-2019
Source: Trends investing: finding the winners among skewed equity returns, Steef Bergakker, Senior Portfolio Manager, Robeco, Insights via Investment Office