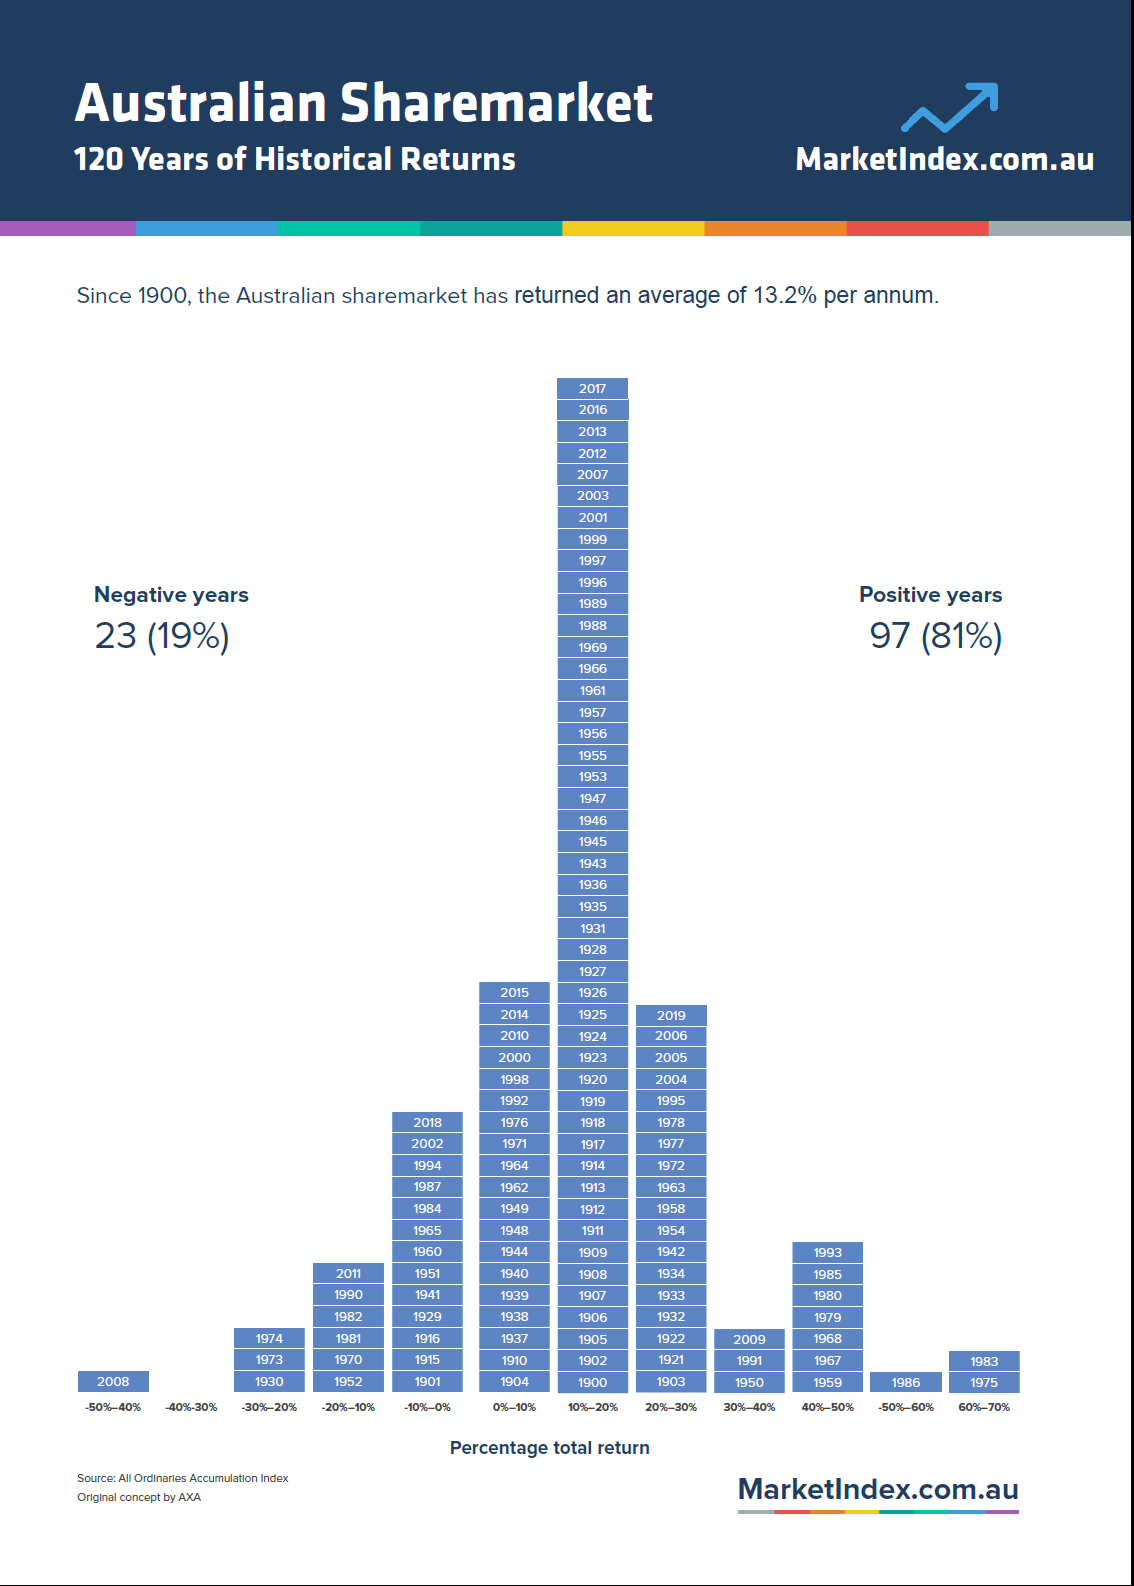
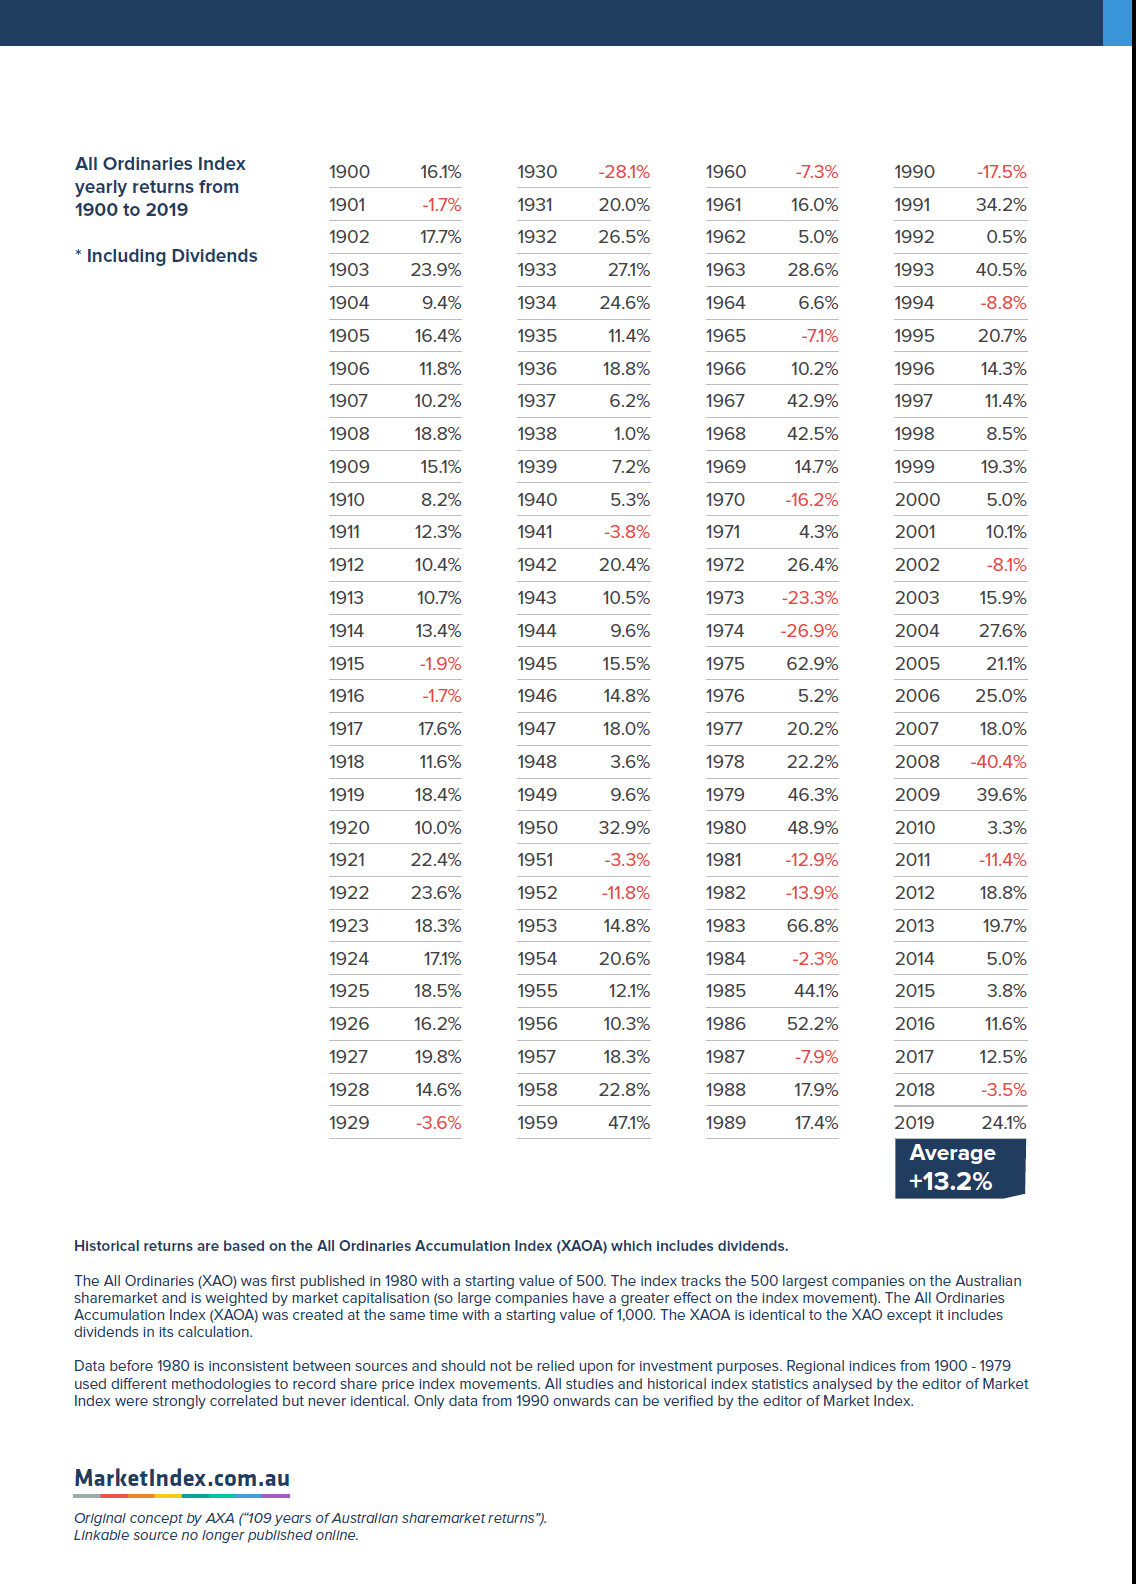
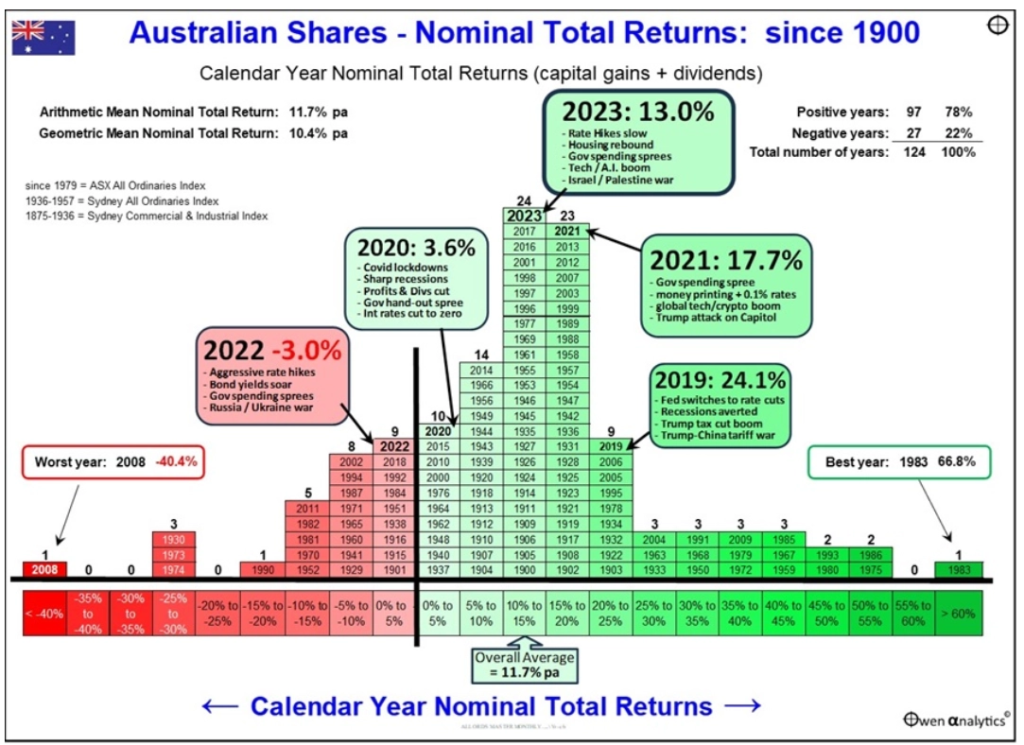
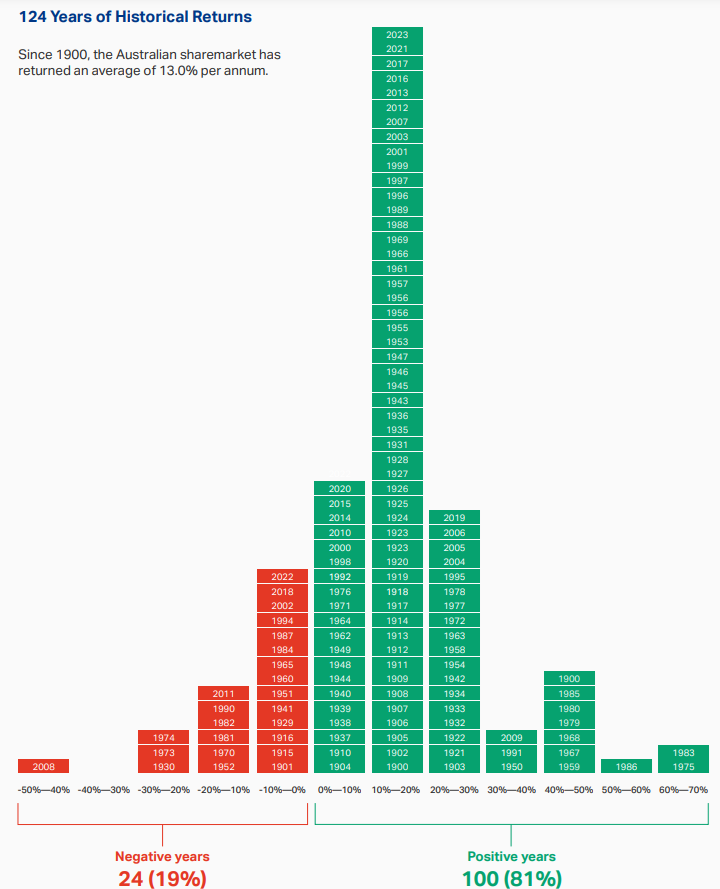
The popular “120 Years of Historical Returns for Australian Sharemarket” has been updated MarketIndex site with data for year 2019. The overall average annual total return just slightly increased to 13.2% per year since 1900.
Update (5/30/21):
The Total Return for the All Ordinaries Accumulation Index in 2020 was 3.64%. The Price Only Return was just 0.71%.
Source: S&P Global
Note: The below chart will be updated with 2020 data when MarketIndex publishes the updated chart.
The following graphic shows the historical annual returns of Australian stocks from 1990 thru 2019:
Click to enlarge
Source: Market Index
Notes:
- The returns shown above are total returns (i.e. share price returns + dividends).
- The returns shown are in the local currency.
- The returns are for the All Ordinaries Index.
Related ETF:
- iShares MSCI Australia ETF (EWA)
Download:
See Also:
Disclosure: No Positions
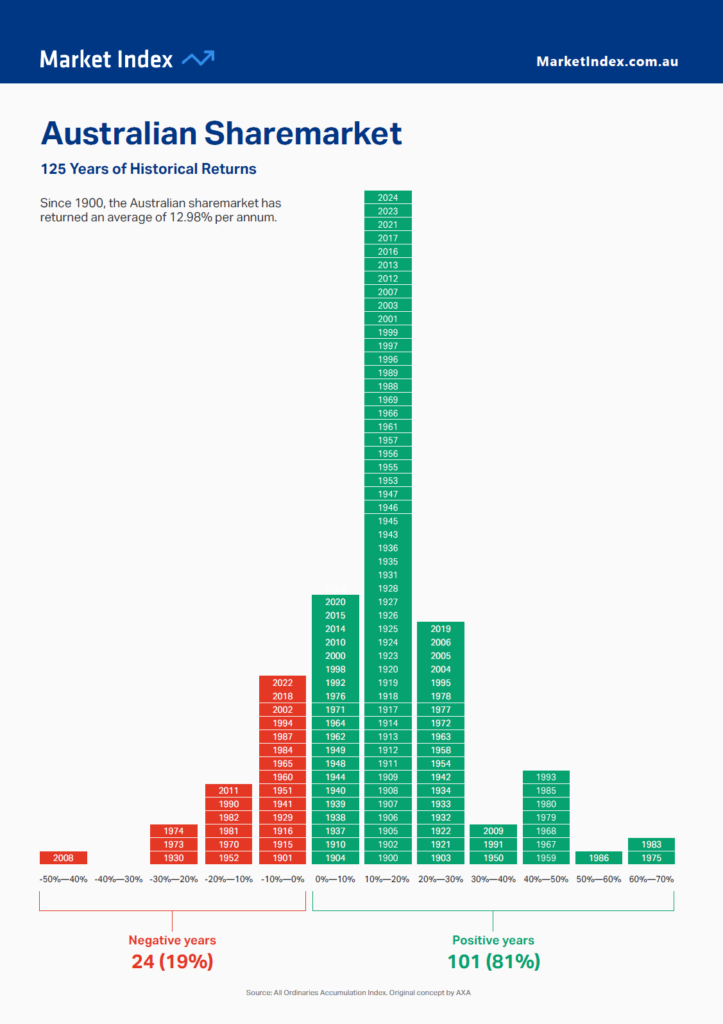
Could you please update the chart for 2020 and post. Thank you.
Sorry. I will post the updated chart once MarketIndex publishes it. I sourced it from them. For now I have added the total return for year 2020 in the details above. Thanks.
Hi David
I am busy writing a book on the sharemarket and Market Index have kindly provided permission for me to use their 120 year chart. I came across your excellent site and see you have added in 2020 returns (like I did). Do I require any permission from you to quote your website please?
Many thanks
Kind regards
Keith
K Foreman
15 Kailas Court, Tamborine Mountain QLD 4272
Hi Keith
Thanks for reaching out.
Nope. You do not need my permission to quote from my website.
A credit is appreciated.
Good luck with your book !
Thanks.
For those interested. I’ve put together my own long term Australian stock market history (1882-2021) based on the work of Brailsford et al.(2012).
Check it out here:
https://jazon-data.shinyapps.io/australianstockmarketapp/
You can use the web app to interact with the data and/or download data in .csv.
Cheers,
Jason
Cool. I will check it out. Thanks for sharing.
-David