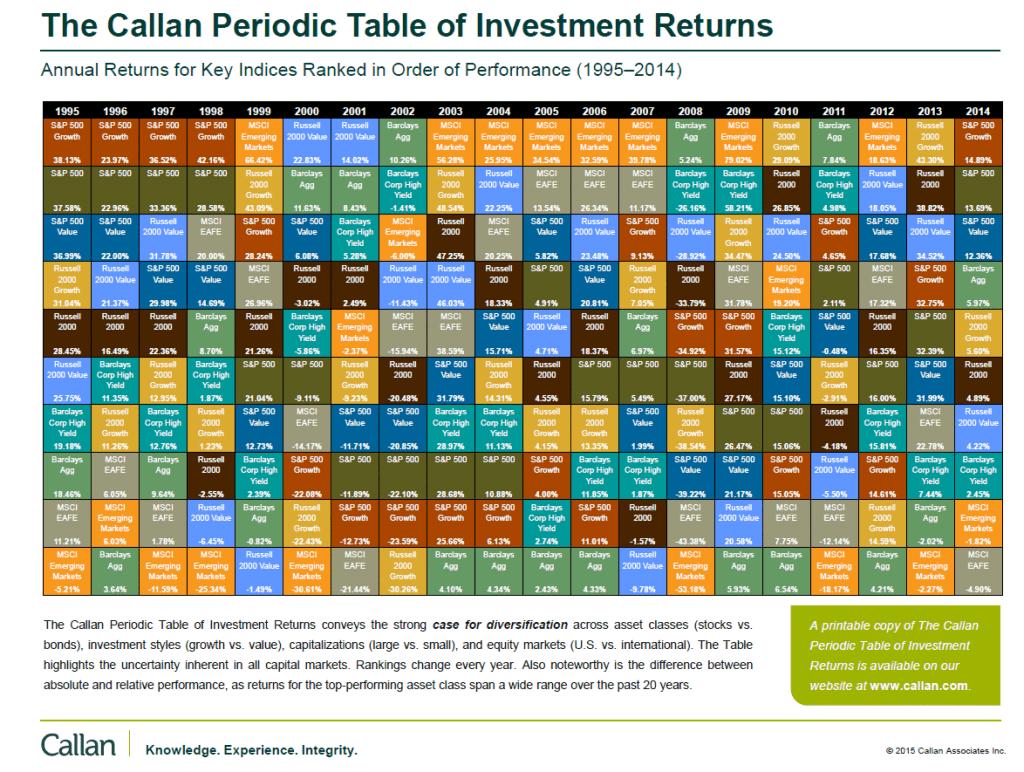
Callan Associates has updated their famous Periodic Table of Investment Returns with data for 2014. It is interesting to review this chart every year and analyze how markets performed across the world.
The Callan Periodic Table of Investment Returns for 2014 is shown below:
Click to enlarge
Source: Callan Associates
A few observations:
- For 2014, the U.S. market as represented by the S&P 500 was the best performer with a price return of 13.69%.
- The MSCI indices for emerging markets and EAFE were down by 1.82% and 4.99% respectively.
- This chart once again shows the importance of diversification. For example, bonds returned a solid 5.97% last year compared to the disastrous performance of emerging market stocks.
- Since the global financial crisis in 2008, the S&P 500 has has double digit growth every year except 2011. So investing in an index fund such the SPY ETF is a prudent strategy for some retail investors as opposing to trying to pick individual companies.
- Emerging market equities had spectacular runs for five years from 2003 till 2007 but have lost their shine since the financial crisis as the global commodity boom ended. So the takeaway is that one cannot simply invest in an emerging fund for the long-term without making any changes. Identifying and selecting high-quality companies is a must in emerging markets.
Related ETFs:
- iShares Dow Jones Select Dividend ETF (DVY)
- SPDR S&P Dividend ETF (SDY)
- Vanguard Dividend Appreciation ETF (VIG)
- SPDR S&P 400 Mid Cap Growth ETF (MDYG)
- iShares Russell Midcap Index Fund (IWR)
- iShares MSCI Emerging Markets Indx (EEM)
- SPDR S&P 500 ETF (SPY)
- SPDR STOXX Europe 50 ETF (FEU)
Disclosure: No Positions
You may also want to checkout the Callan Table for 2013, 2012, 2011 and 2010.
Download: The Callan Periodic Table of Investment Returns 1995-2014 (in pdf)
Related: The Callan Periodic Table of Investment Returns 2016: A Review

