Every year Credit Suisse publishes their famous Global Investment Returns Yearbook. This year’s version was released back in February. This year’s report includes many fascinating charts and facts. The entire report is worth a review.
Below are some sample charts from the Credit Suisse Global Investment Returns Yearbook 2014:
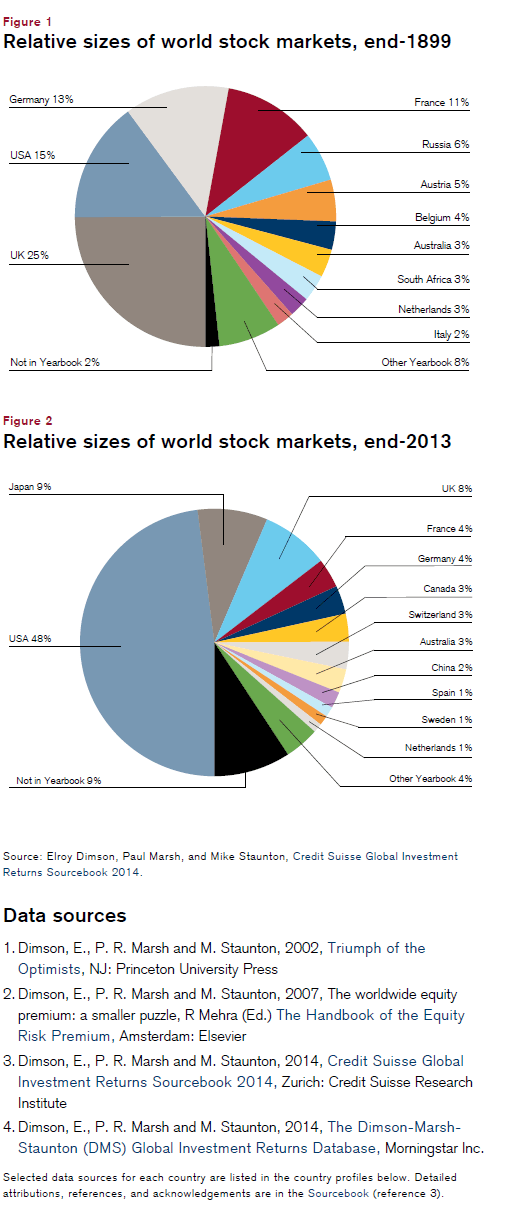
1) Relative size of World Stock Markets at the end of 1899 and 2013
Click to enlarge
At the beginning of the 20th century the UK’s equity market size was one-fourth of the total global equity market. With the loss of most of it colonies in the early 1900s British power and influence declined. Accordingly the dominance of British companies also declined.
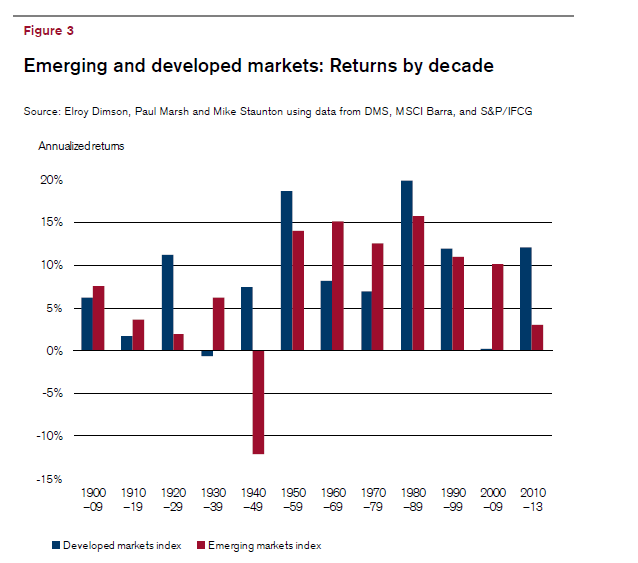
2) Emerging and Developed Markets’ Equity Returns by Decade
You can download the full report by clicking on the image below or here.
 Source: Credit Suisse Research Institute
You can find the 2013 Yearbook here.
