The Periodic Table of Annual Returns for Canadians has been updated for 2022 by Stingy Investor. This table shows the performance of various asset classes by year in Canadian dollars. The chart below shows the returns from 2012 to 2022. For earlier year returns click on the link and you can use the arrows to get historical data. Last year the TSX performed relatively better than the S&P 500 but still in the negative.
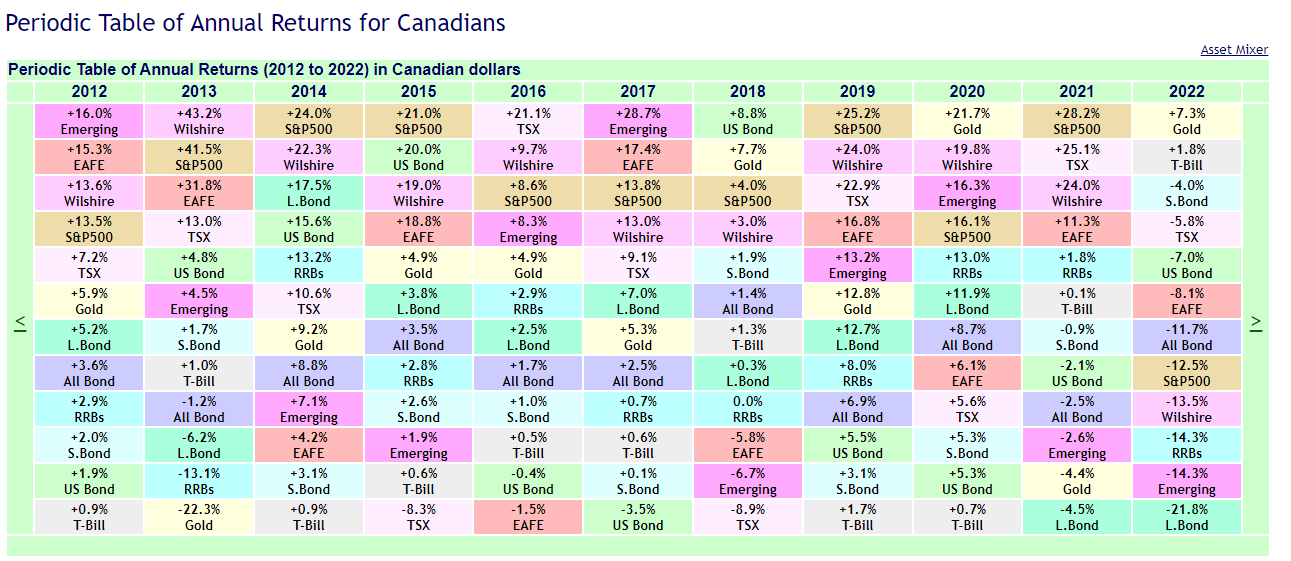
Source: Stingy Investor
Data Sources: Many thanks to Norbert Schlenker at Libra Investment Management for collecting the data that this calculator uses. Original public data sources include: Bank of Canada, BC Government Statistics, Canadian Institute of Actuaries, Economagic.com, Financial Post, Globe & Mail, globefund.com, Kitco, Libra Investment Management Inc., MSCI, Prof. Werner Antweiler (UBC), Scotia Capital, BMO, Standard & Poors, Statistics Canada (Table 326-0001), DH&A, and Wilshire Associates.
Related ETFs:
Disclosure: No positions