The Annual Total Returns of Dow Jones Industrial Average from 1896 to 2021 is shown in the chart below. It proves the known fact that stocks tend to go up in the long-term. During the period shown, the Dow was up nearly three-fourth percentage of the time and only down one-fourth of the time. Here are a few fascinating points from the detailed article by Drew Dickson at Albert Capital:
- Since 1980, the US market has been up for the year 83% of the time.
- From 2003 to 2021, the market has been up all years except just two.
- Since 2009, the market has been down only one year.
Click to enlarge
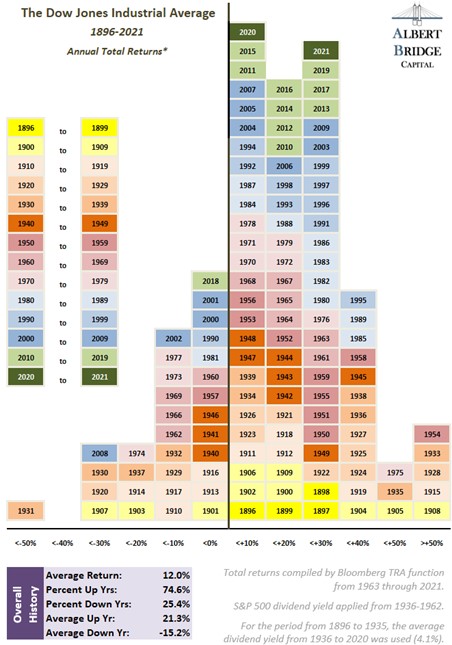
Source: Albert Capital via Novel Investor
He also makes other interesting observations such as comparing US equities to European equities in the above linked piece.
It remains to be seen if the current bull market will continue this year with the market a multitude of headwinds the most important of which is rising rates.
Related ETFs:
Disclosure: No positions


