The equity market tend to go higher than lower especially over the long-term. In the short-term measured in months or even a few years the market can be volatile and can decline sometimes when it feels like there is no end in sight for the downward trend. Similarly to the benchmark S&P 500, the Dow Jones Industrial Average also has had bull and bear market over the years and the bull market duration and returns have exceeded that of the bear markets as shown in the chart below. From 1942 to 2020, the average bull market has been over 4 years while the average bear markets has been just over 1 year.
Click to enlarge
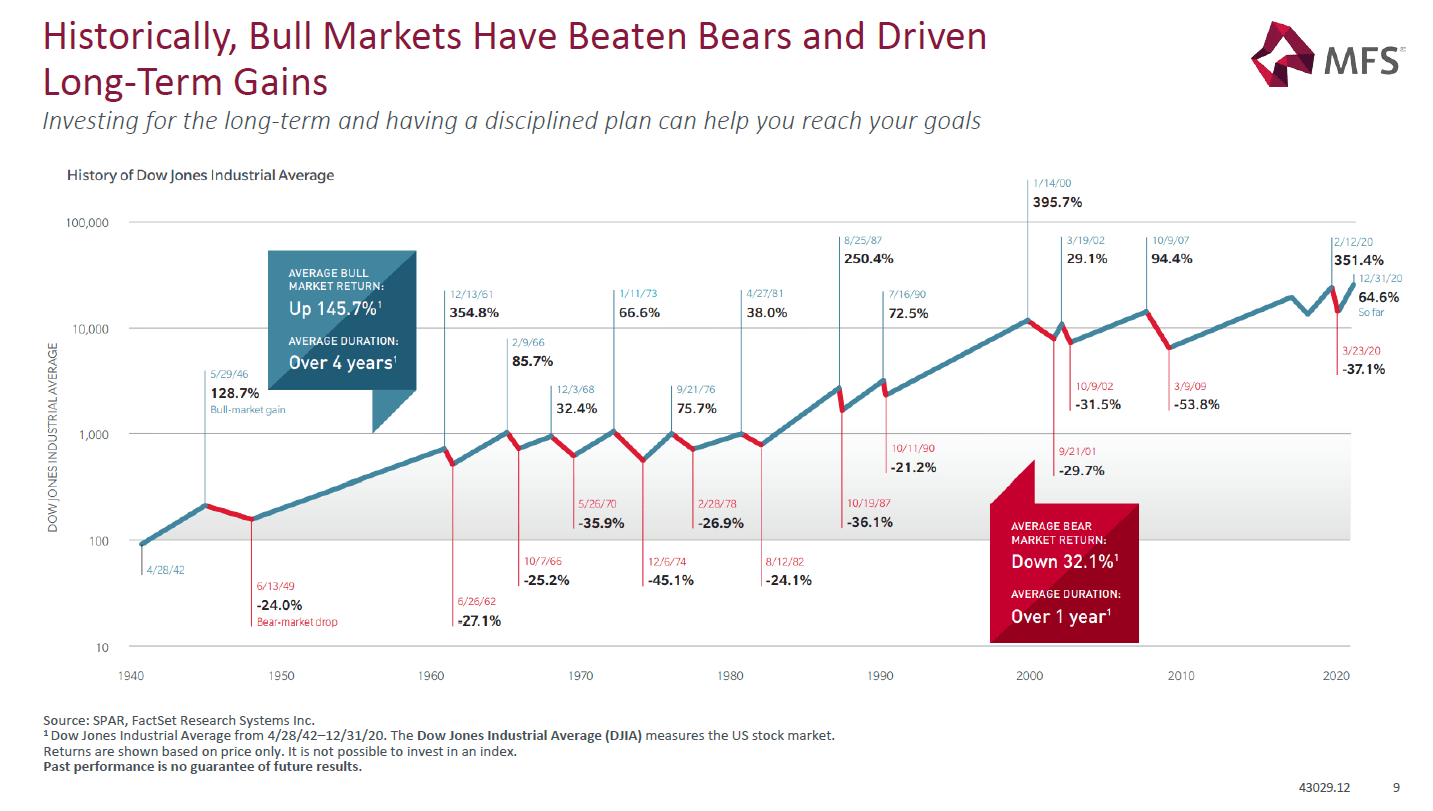
Source: Principles of Long-Term Investing Resilience, MFS
So the key takeaway is that stocks never go up forever as some investors currently seem to believe. The wise strategy is to have a solid long-term goal and focus on the returns over many years and not worry about day to day fluctuations. Simply being patient and riding out the down days can lead to excellent returns.
Related ETFs:
Disclosure: No positions