Diversification is a simple and easy strategy to beat market volatility. Diversifying one’s assets in a portfolio among various asset classes is one of type of diversification. The following chart shows the total return of various asset classes from 2004 thru 2018.
Click to enlarge
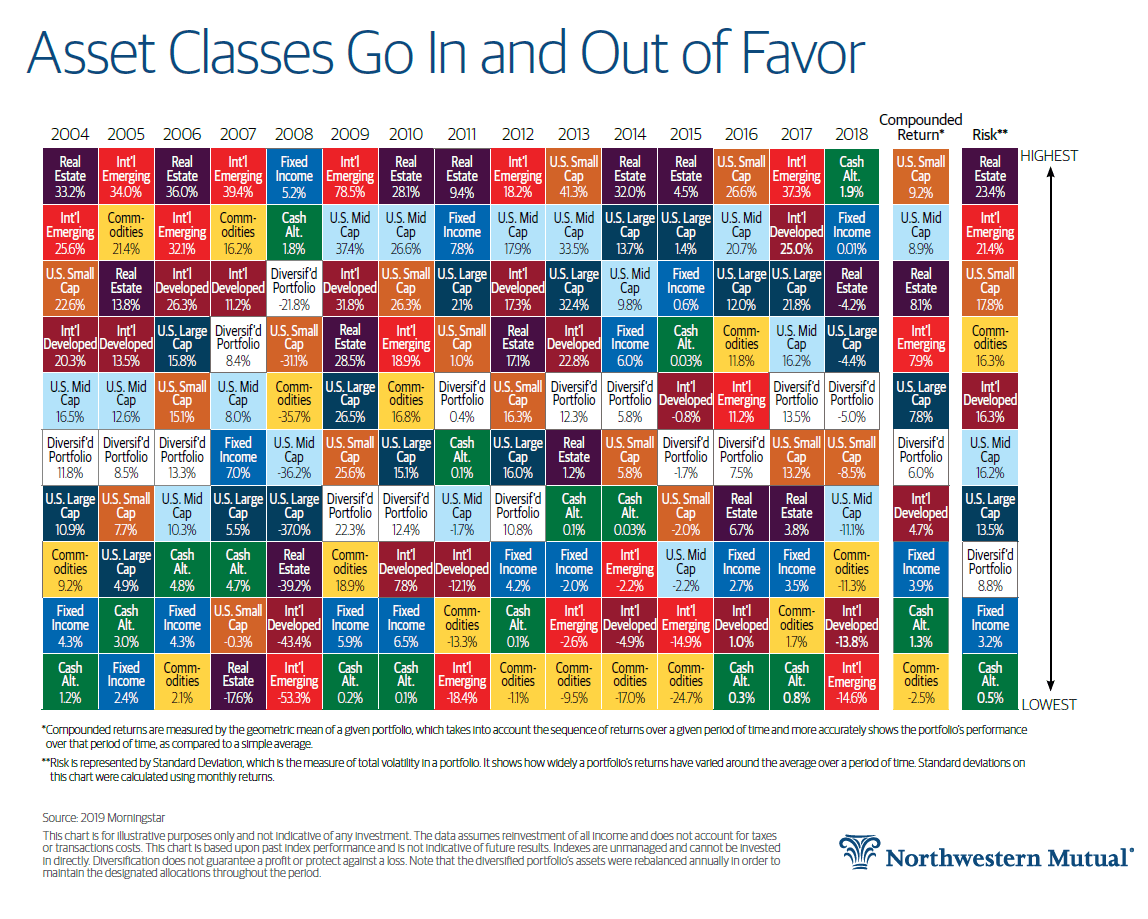
Source: What Asset Diversification Looks Like, in One Chart, Northwestern Mutual
The chart shows in a colorful way that different asset classes perform differently in a given year.In 2009, for example emerging markets soared by over 78% in total returns only to return only 19% the following year. In 2011, they were the worst performer among the asset classes shown above with a loss of 18%.
Similarly commodities fell for four years in a row since 2013.
So the key takeaway is that it is unwise to hold most of one’s funds in a single asset type – whether it is gold, commodities, real estate, cash, etc. It is always better to own a bunch of different asset types to profit from the wide divergence in their returns year over year.


