On of the simplest and easiest ways to reduce risk in a portfolio is diversification. Holding assets spread across different types, classes, countries, etc. not only reduces risks but also provides a cushion to a portfolio when markets head south as we witnessed in December 2018. The following chart shows the importance of diversification as no one asset class was the best performer every year.
Click to enlarge
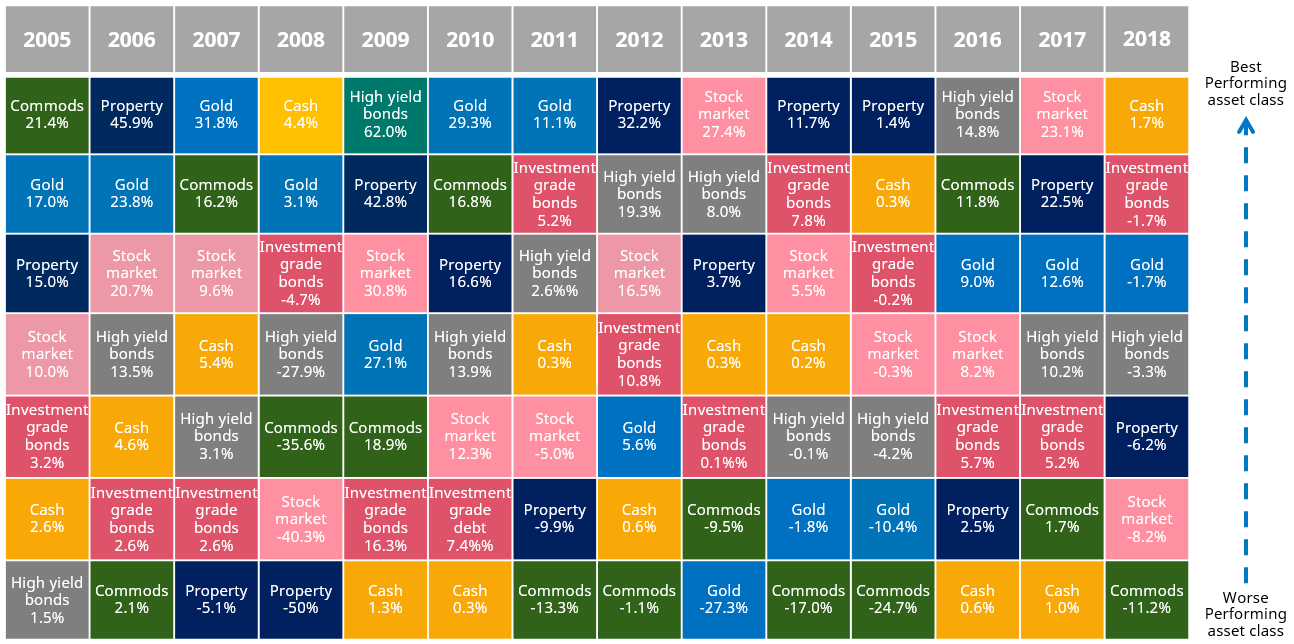
Note Past performance is not a guide to future performance and may not be repeated.
Source: Schroders, Refinitiv data correct as of 01 January 2019. Stock Market: MSCI World Total Return Index, Property: Thomson Reuters Developed Market Real Estate Total Return Index. Cash: IBA US dollar interbank LIBOR 3 month, High Yield Bonds: BofA Merrill Lynch Global High Yield TR Index, Investment Grade Bonds: ICE BofAML Global Corporate Total Return Index, Commods: Bloomberg Commodity Index, Gold: Gold Bullion LBM $/t oz. All show total return in local currency.
Article source: 14 years of returns: history’s lesson for investors, David Brett, Schroders


