Jeffrey Kleintop at Schwab has posted a fascinating article on the dangers and returns of international and US investing using the example of a shark attack.
The following is an excerpt from the article:
US and International
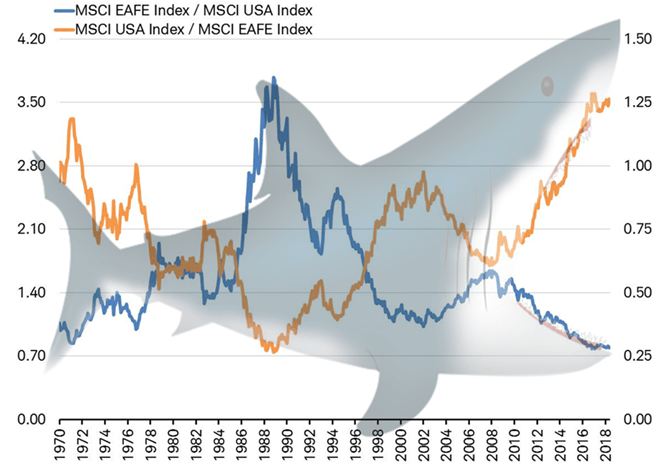
The chart below shows us what stock market shark attacks look like using the relative performance of US and international stock indexes. The lines are just one index divided by the other. When the blue line is rising international stocks are outperforming U.S. stocks. When the orange line is rising U.S. stocks are outperforming international stocks. They are mirror images of each other.
Shark attack: U.S. versus International
Source: Charles Schwab, Bloomberg data as of 5/13/2018. Past performance is no guarantee of future performance.
In the early 1970s, the jaws were gaping wide. As international stocks began to outperform, the jaws began to close and take a big bite out of the portfolio of investors who hadn’t rebalanced. The jaws opened again in the late 1980s as the outperformance of international stocks became extreme, only to see them bite down again in the following years. Now, the shark’s jaws are open wide again after 10 years of U.S. stock market outperformance. We could again be on the cusp of a shark attack.
No one knows for sure if we have seen the peak of U.S. stock market outperformance of international stocks; the shark jaws could open wider before biting down. But the risk of a shark attack appears to us to be pretty high. Prepared investors should be thinking about being a contrarian and rebalancing their portfolios from the U.S. to international stocks after a decade of U.S. outperformance.
Source: How To Avoid A Shark Attack by Jeffrey Kleintop, Charles Schwab
The entire post is worth a read.


