The fundamental long-term trend of the US economy is a slow downward slope according to a recent article by Prof. John Ross at Renmin University of China. The average annual growth rate of the US economy fell from 4.4% in 1969, to 4.1% in 1978. Then it fell again to 3.2% in 2002. By the first quarter of this it reached a low of 2.2%.
The following chart shows the US long-term annual growth rate:
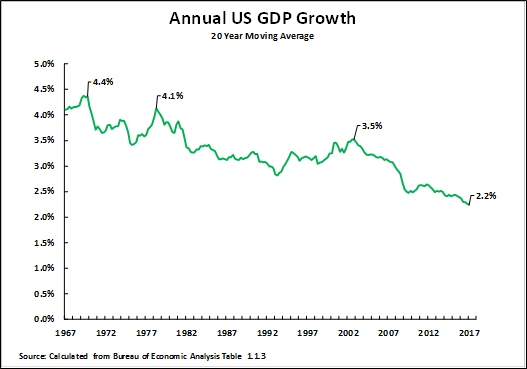
Source: Why the US economy remains locked in slow growth, Key Trends in Globalisation, June 12, 2017
Though the economy has slowed down considerably since the 70s the equity markets have had multiple bull markets since then including the most recent bull market after the global financial crisis.

Interesting. It looks like growth is just a phase, not something that can continue, exponentially, for ever. This pattern seems to be the same in all developed countries. Also interesting is that projecting forward to find the date at which growth reaches 0% you discover it coincides approximately with projections for when the oil runs out (assuming business as usual, i.e. no climate mitigation). Hopefully the world’s economists have all spotted this and are working responsibly to prepare our institutions for a post growth world.