Investors invest for the long-term and traders trade for short-term gains. The distinction is important when it comes to success in investing. Since most retail investor invest in equities to meet a long-term goal such as a retirement it is important to focus on total returns of an index as opposed to price returns when bench marking one’s portfolio returns. Since total returns includes dividends reinvested generally the returns will be higher than simple price returns.
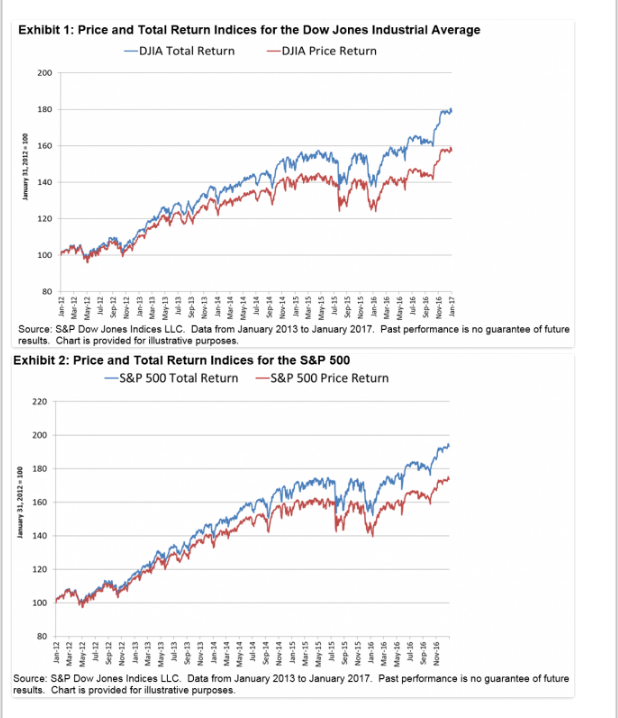
The following chart shows the total returns vs. price returns for the Dow Jones Industrial Average and S&P 500 for five years ending in Jan, 2017:
Click to enlarge
Source: Index Basics: Calculating an Index’s Total Return by Reid Steadman, Indexology by S&P Dow Jones Indices
For the period shown above, the total return index for the Dow was ahead of its price return index by 13.5%. For the S&P 500 the difference was 11.3%.
Related ETFs:
Disclosure: No Positions


