Update: The Callan Periodic Table of Investment Returns 1998-2017
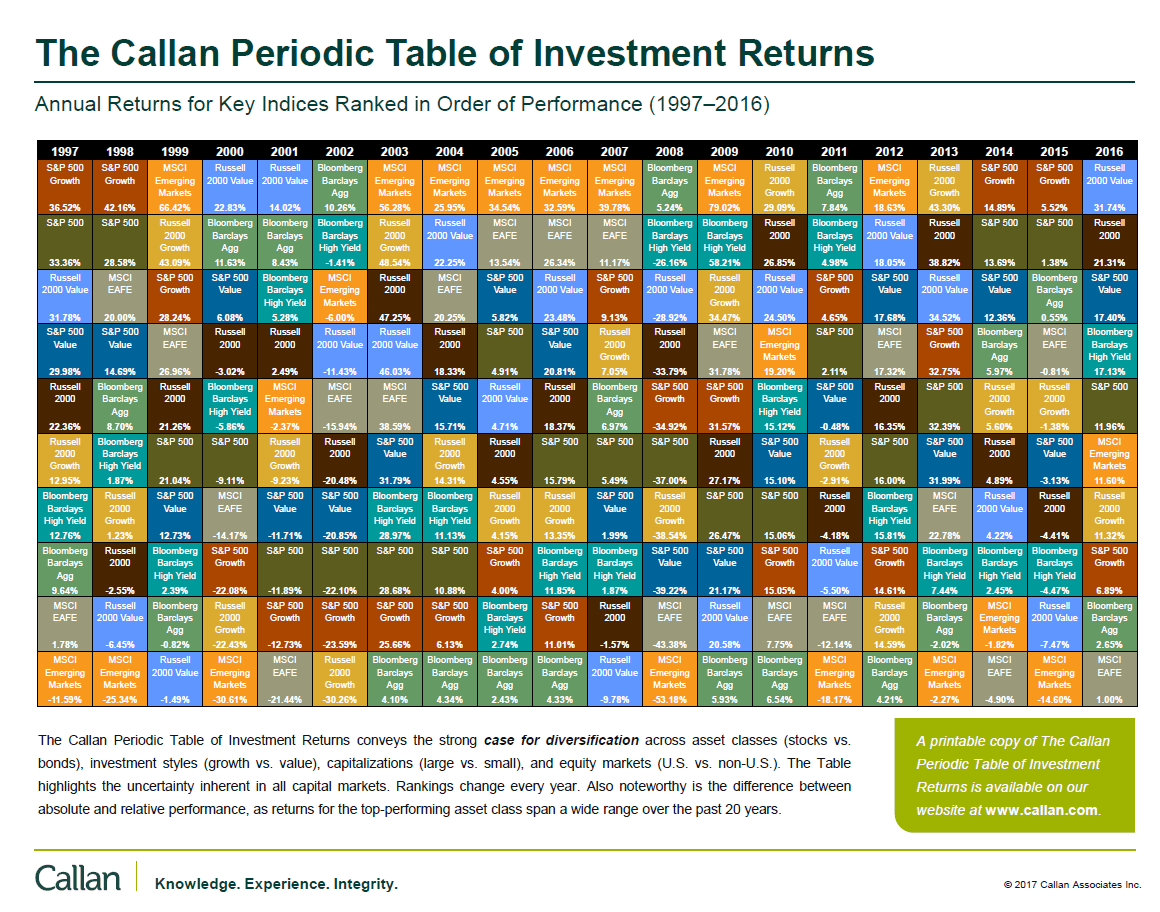
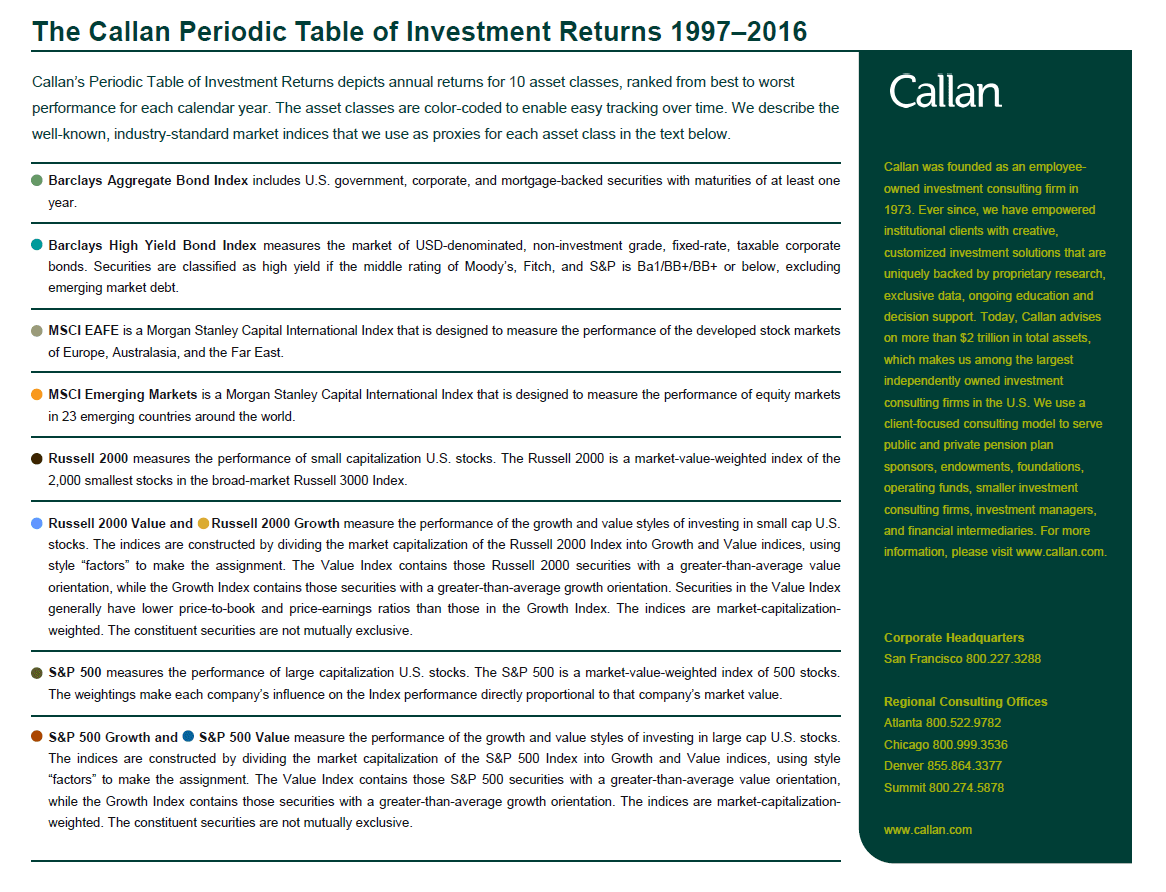
Callan Associates has published their “The Periodic Table of Investment Returns for 2016”. This fascinating chart shows the returns of various of classes such as stocks, bonds, US and foreign stocks, etc. The importance of diversification among asset classes is vividly illustrated by the Callan chart each year.
The Callan Periodic Table of Investment Returns for 2016 is shown below:
Click to enlarge
Source: Callan Associates
Download: The Callan Periodic Table of Investment Returns 1997-2016 (in pdf format)
In 2016, the S&P 500 had a total return of 11.96%. While this is a good return, the small caps as represented by the Russell 2000 earned even higher with a return of over 21%. Emerging markets also performed well last year. But European stocks were the worst performers as the MSCI EAFE Index had a return of just 1%.
For the Year 2017 version of Callan Chart go here.
Previous Year Callan Charts:
- Review: The Callan Periodic Table of Investment Returns 2015
- Callan Periodic Table of Investment Returns: Emerging Markets From 2006 To 2015
Related ETFs:
- iShares Dow Jones Select Dividend ETF (DVY)
- SPDR S&P Dividend ETF (SDY)
- Vanguard Dividend Appreciation ETF (VIG)
- SPDR S&P 400 Mid Cap Growth ETF (MDYG)
- iShares Russell Midcap Index Fund (IWR)
- iShares MSCI Emerging Markets Indx (EEM)
- SPDR S&P 500 ETF (SPY)
- SPDR STOXX Europe 50 ETF (FEU)
Disclosure: No Positions
