One of the key factors for success in equity investing is diversification. This strategy allows an investor to reduce volatility in a portfolio during adverse market conditions and helps smooth out returns over many years.
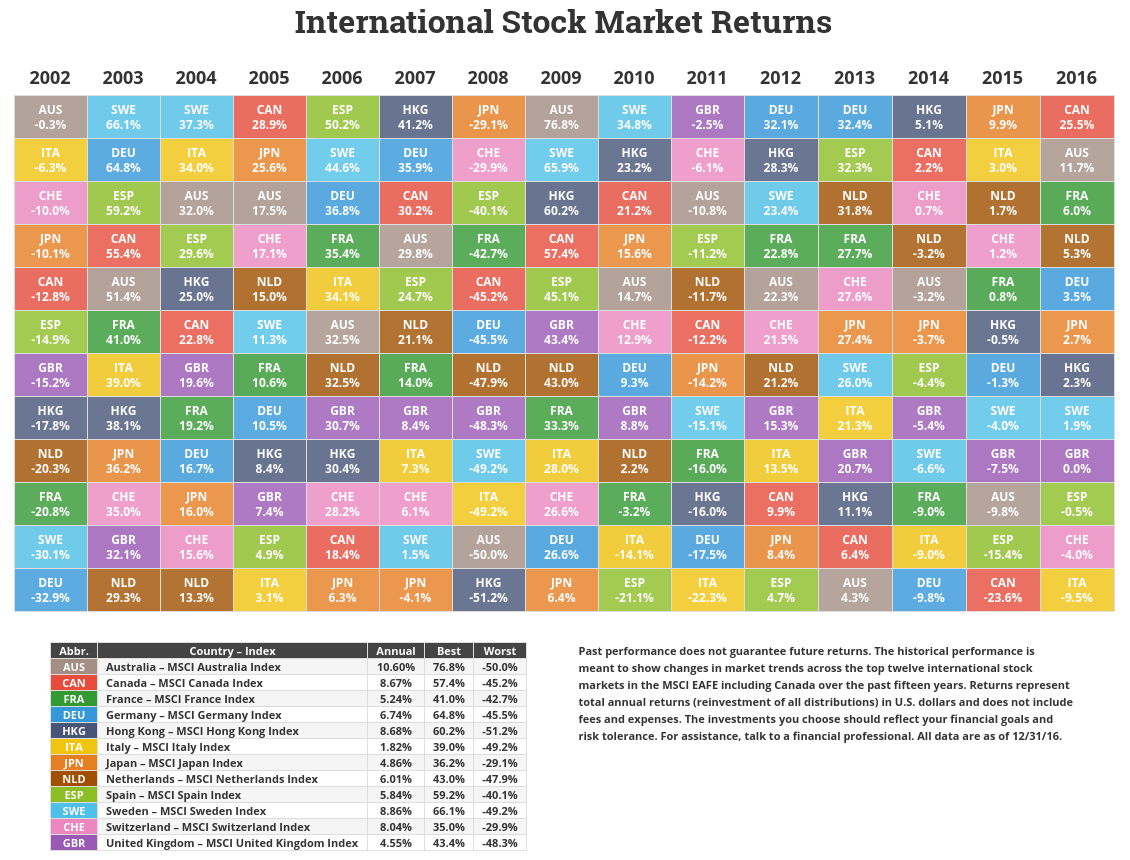
I recently across the following Periodic Table of Investment Returns Chart showing the annual MSCI Total Returns of select developed markets from 2002 thru 2016:
Click to enlarge
Source: Novel Investor
Last year, Canada was the top performer with a return of over 25% in US dollar terms and Italy was the worst performer.
For an interactive version of the above chart please go here.
Related: Review: The Callan Periodic Table of Investment Returns 2015


