The S&P 500 is up by 1.80% year-to-date. Oil prices have recovered strongly from the recent plunge. In fact, Brent crude closed at $43.10 yesterday after falling below $30 per barrel in January. When it went below $30, experts were predicting $20 or even $10 per barrel. Now that it is over $40 not surprisingly they have become quiet. They may reappear in the media when oil prices $60 some in the future calling for prices to reach $100 soon.
From the beginning of the year until recently oil prices and the stock markets went up and down in tandem. It appeared stock prices were only determined on the price of oil movements. Some experts even starting monitoring the price of oil every day to make their decisions on equities. Though oil and all stocks seemed to be joined at the hip, in reality volatility in oil prices impacting the entire equity market did not make sense.
In general, what is the long-term relationship between oil and stocks? Long-term relationship is important to review as opposed to the short-term since most investors are not investing in equities for 1 month, 3 months, 1 year or even 5 years. So daily oil price movements does not matter to investors who have a long-term focus where it is building a retirement nest egg or saving for college tuition or simply building wealth.
I written before that oil is one of the most volatile commodities in the market. So worrying too much about oil and its impacts on equities day in and day out is not wise.
In an article published this week, Ken Fisher, Founder and Chief Executive of Fisher Investments noted that the long-term relationship between oil and stocks is meaningless. From the article:
MEANINGLESS
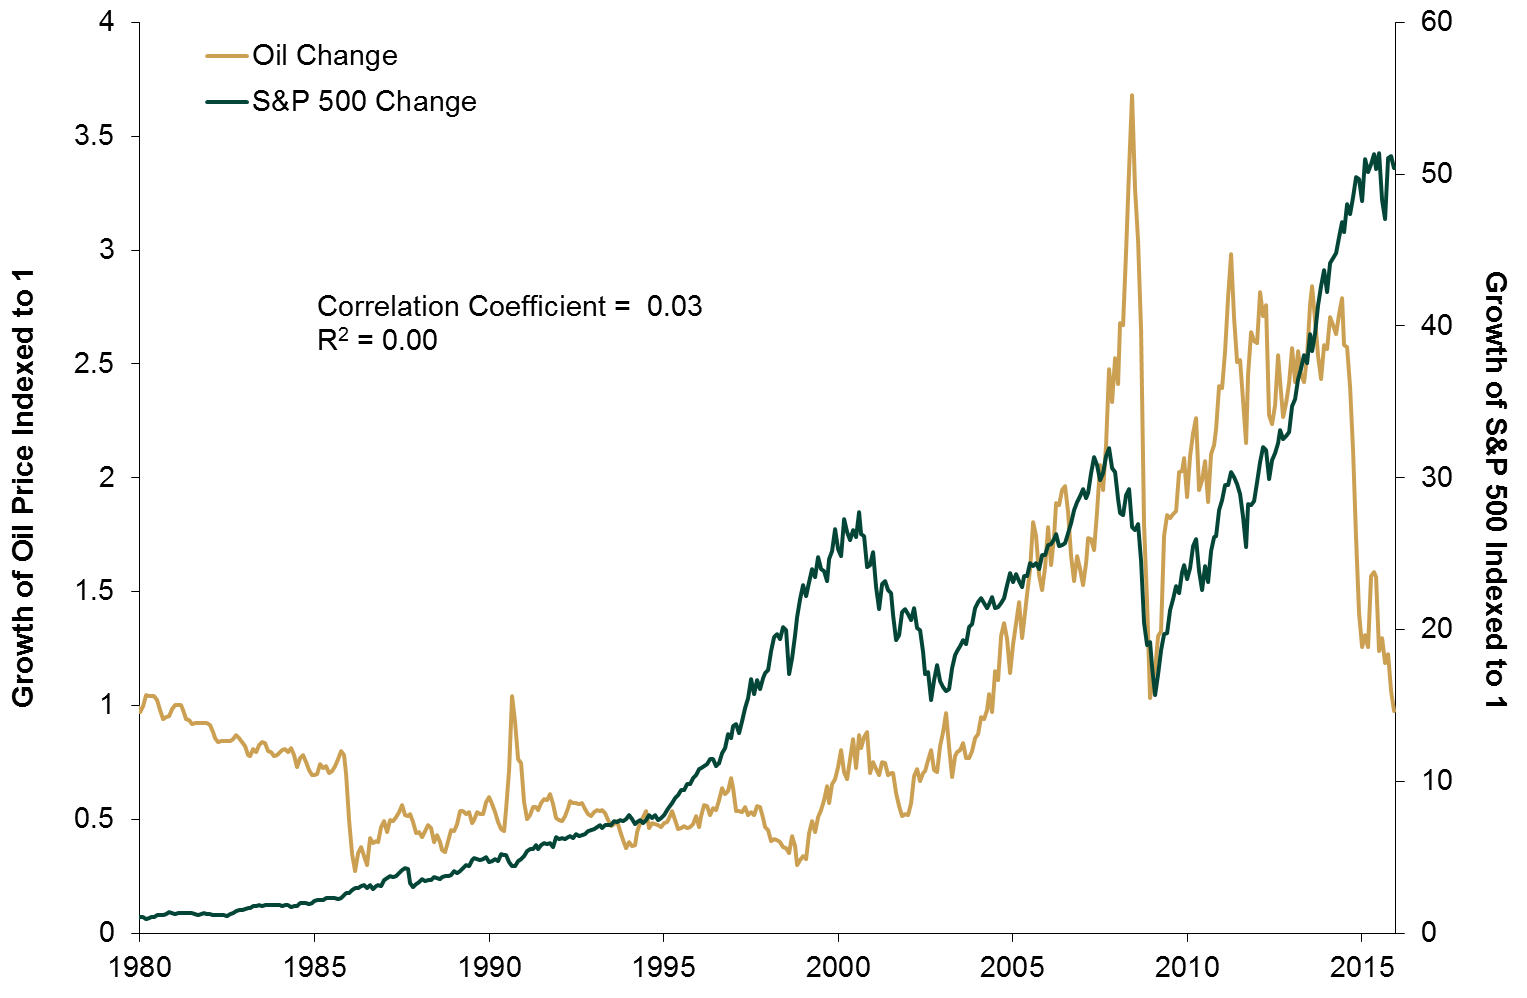
Figure 1 (below, click to enlarge) shows monthly returns for both US stocks and oil. The correlation co-efficient is a number between +1 and -1 that shows how much two variables move together.
The higher the number, the more positively correlated they are – zigging together at the same time and to the same degree.
A number close to -1 means they’re negatively correlated – they zigzag the way the myth presumes oil and stocks do. A number close to zero means the two have no relation – one zigs and the other broccolis.
Click to enlarge
Since 1980, the correlation between oil and US stocks is 0.03. Meaningless – the two aren’t related in the long term at all (by the way, you can do the same thing with oil and UK, German, Japanese, and world stocks, and get the same meaningful lack of correlation).
Now look at the R-squared, which tells us how much of one variable’s movement can be explained by the other. Here, it’s 0 per cent. Said another way, over long periods, anything and everything but oil contributes to the stock market’s movement.
Can oil prices impact certain industries and firms more directly? Sure! Energy firms for a start, particularly if they’re drilling, refining, and/or selling oil or oil products. But overall, oil and stocks aren’t correlated – positively or negatively.
That’s longer term. Over shorter periods, oil and stocks can have short spurts of intense positive or negative correlation. But any two bizarre variables can inexplicably move together (or oppositely) for short spurts. It means nothing.
Source: Oil and stocks seesaw: Fisher’s financial mythbusters, Ken Fisher, Money Observer, April 15, 2016
Oil prices do impact directly firms operating in that particular industry such as producers, refiners, marketers, pipeline operators, equipment providers, etc. But the impact on other industries is indirect and some are affected more than others. In fact, some industries benefit from lower prices and vice versa. So investors are better off to consider many of the other factor that impact stock prices and not purely zoom in on oil price movements to make their long-term investments.