The FTSE/JSE All Share Index is the benchmark index of the South African equity market. According to the index provider FTSE:
The FTSE/JSE All-Share Index represents 99% of the full market capital value i.e. before the application of any investability weightings, of all ordinary securities listed on the main board of the JSE, subject to minimum freefloat and liquidity criteria.
Currently there are 163 constituents in the index and the dividend yield is 3.23% in the domestic currency. The Top 10 holdings account for 56% of the index. The top three sectors represented in the index are: Food & Beverage, Personal & Household Goods and Basic Resources.
Global Exposure of South African firms:
Similar to the FTSE 100 index of the UK, many South African firms in the FTSE/JSE All Share index earn a high portion of their revenues from overseas. In fact, according to a report by Factset only 45% of the total 5,387 billion rand revenue of the firms in the index is earned locally. This shows the global exposure of major South African firms.
Click to enlarge
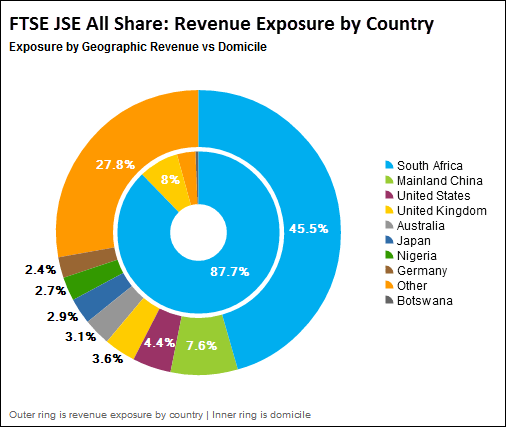
Source: Tethered South African Investors Seek Gains Beyond Borders, FactSet
From an investment standpoint, though only some sectors are heavily dependent on the local economy. For example, resource companies such as those in mining have major operations within the country. But large South African banks such as Nedbank (NDBKY) or Standard Bank (SGBLY)on the other hand have substantial presence in other African countries. So their performance is not totally dependent on the state of the South African economy.
The Top 10 Constituents of the FTSE JSE All Share Index are shown below:
Click to enlarge
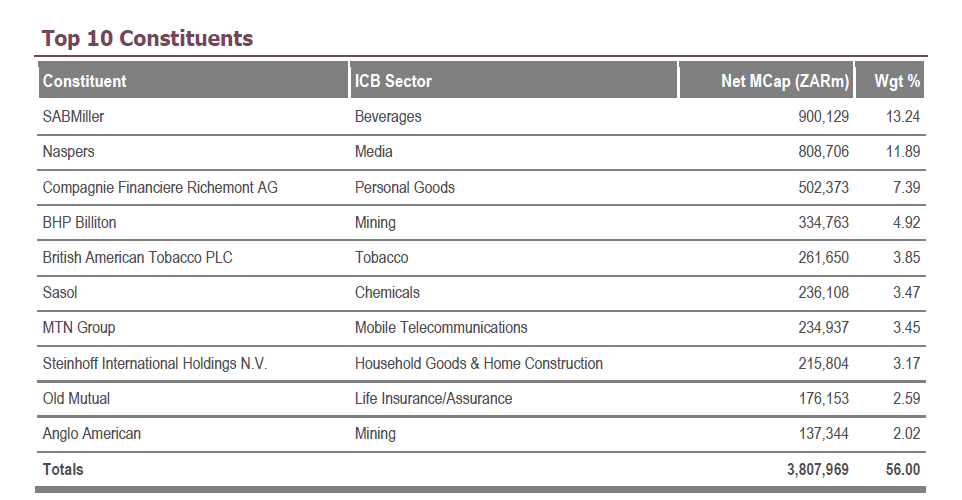
Source: FTSE
The full list of South African ADRs trading on the US markets can be found here and also check out the historical performance of the index.
Disclosure: No Positions
You may also like: