Earlier this month I posted the Callan Periodic Table of Investment Returns for 2015. The following is The Periodic Table of Emerging Markets 2015 which shows the annual returns from 2006 thru 2015:
Click to enlarge
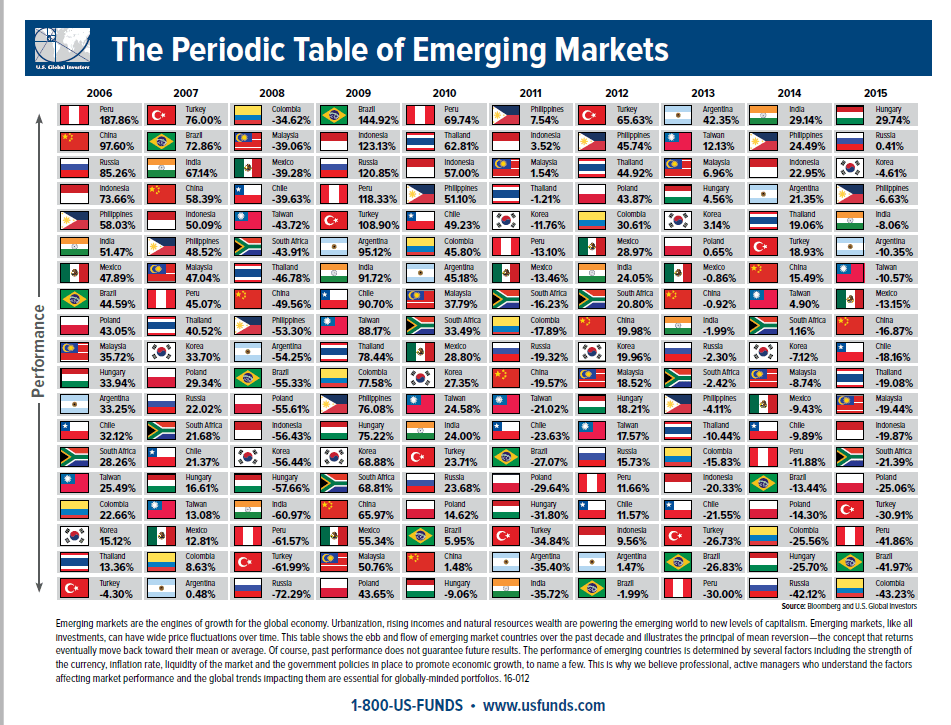
Source: US Funds
Download: The Periodic Table of Emerging Markets 2015 (in pdf)
A few observations:
- Last year the best performing market was Hungary with a return of about 30%. This is surprising since Hungary is hardly on any EM investors’ radar.
- The top three worst performing markets were all from Latin America – Colombia, Brazil and Peru.
- Brazil lost its shine back in 2010. After topping the ranking in 2009, Brazil has been a negative performing market every year since 2011. Last year it lost an astonishing 42% after a fall of 13% in the previous year.
- Russia was the worst market in 2014. But the market bounced back in 2015 to basically remain flat while most emerging markets declined.


