The S&P 500 is up 6.3% year-to-date (YTD). In the past five years the index has more than doubled. Compared to the performance of the S&P 500, many of the developed market indices are in the negative territory so far this year.The returns of the some major markets YTD are listed below:
UK’s FTSE 100: -5.3%
France’s CAC 40: -3.9%
Germany’s DAX : -5.9%
Spain’s IBEX 35: 4.3%
Canada’s S&P/TSX Composite: 6.8%
Japan’s Nikkei: -6.1%
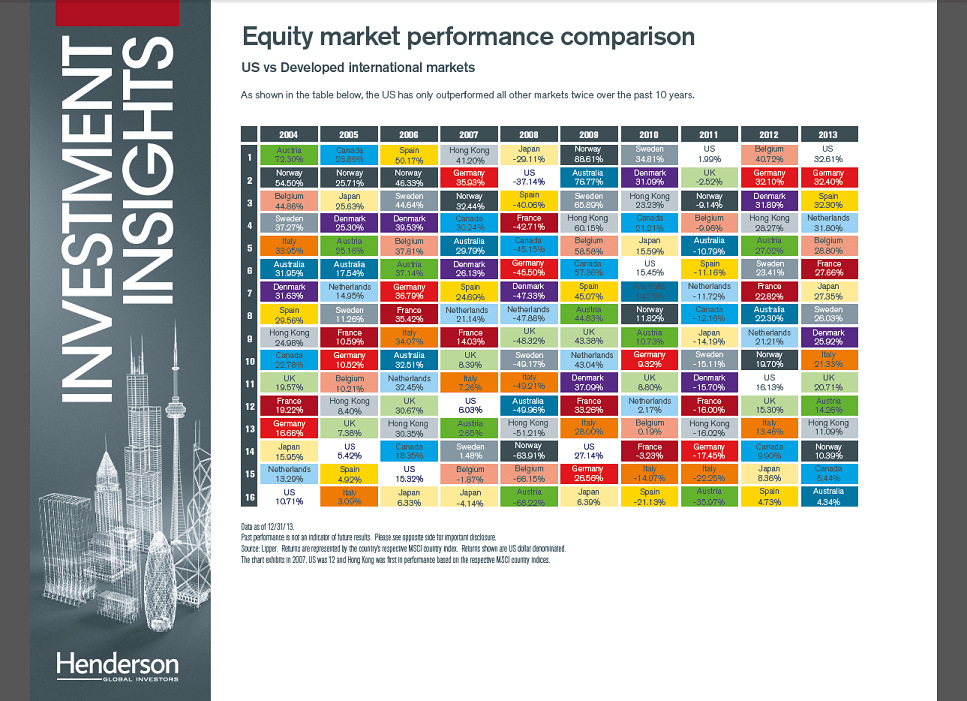
Considering the solid performance of the US markets in the past 5 years and relatively decent performance this year some investors may be tempted to stay away from investing in foreign developed markets. However past performance shows that the U.S. is always not the top performer among developed markets. In fact, the U.S. has only outperformed the other developed markets only twice (in 2011 and 2013) in the past 10 years as shown in the chart below:
Click to enlarge
Source: Henderson Global Investors
Note: The returns shown above are based on the country’s respective MSCI country index.
A few observations from the above chart:
- German stocks yielded a positive return in 8 out of the past 10 years.
- Norway is another top performer with 8 years of positive returns.
- In most of the years shown, Japan’s returns have been a relatively average.
- Similar to Germany, UK was also down in just 2 of the 10 years.
Related ETFs:
- iShares MSCI Australia ETF (EWA)
- Global-X Norway ETF (NORW)
- iShares MSCI United Kingdom ETF (EWU)
- iShares MSCI Canada Index Fund (EWC)
- SPDR S&P 500 ETF (SPY)
Disclosure: No Positions


