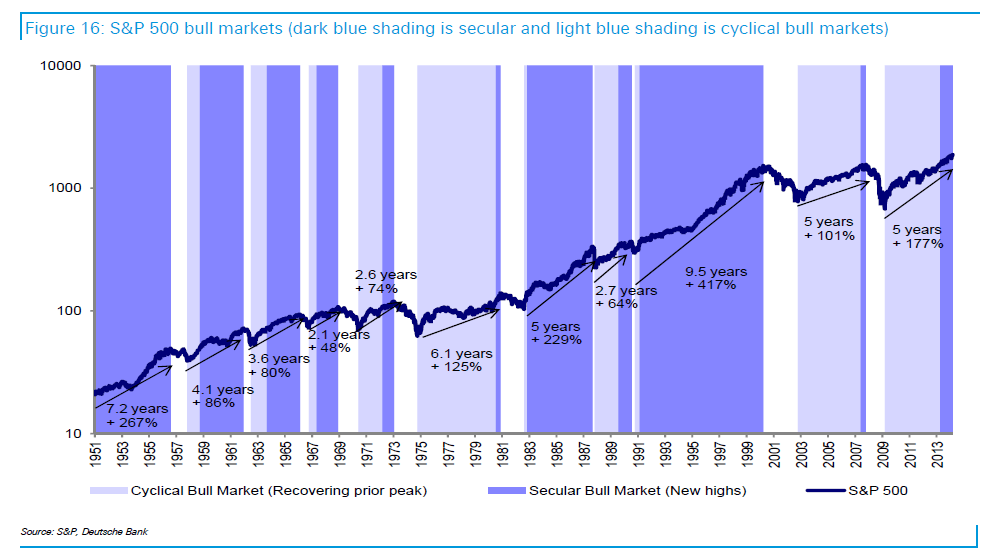
The S&P 500 and the Dow Jones index closed at 16412 and 1865 respectively yesterday. The S&P 500 soared by 30% in 2013 and is flat so far this year. The index has had a spectacular run since the lows reached during the global financial crisis in early 2009.
Here is a chart showing the current bull market in perspective from Deutsche Bank’s US Equity Insights report. The return shown is through March 9, 2014 :
Click to enlarge
The chart below shows the duration of bull markets:
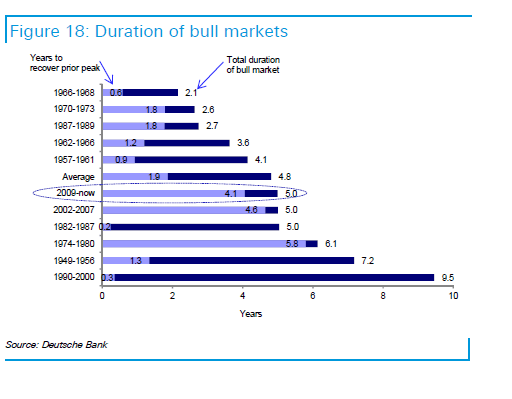
Source: US Equity Insights, Deutsche Bank, March 9, 2014
Related ETF:
- SPDR S&P 500 ETF (SPY)
Disclosure: No Positions


