Reinvestment of dividends can enhance the return of an equity investment. Instead of simply focusing on price returns only investors should focus on the total return of an investment which includes price return plus dividend reinvestment return.
Over the past decade, UK’s FTSE 100 has consistently beaten the S&P 500. The FTSE 100 has had a total return of 171.87% compared to just 89.12% for the S&P 500 in British Pound terms according to a report in FE Trustnet.
However just looking at price charts will give misleading results. In the 10-year and 5 year charts below, the S&P 500(in blue) was ahead of FTSE 100 in US $ terms. But this is only based on price return. When reinvestment of dividends is included the charts will look entirely different with the FTSE beating the S&P by a wide margin. This is because the dividend yield on the S&P 500 is around 2% whereas the FTSE 100 has a much higher yield as British firms traditionally have higher payouts than US firms.
S&P 500 vs. FTSE 100 – 5 Year Return:
Click to enlagre
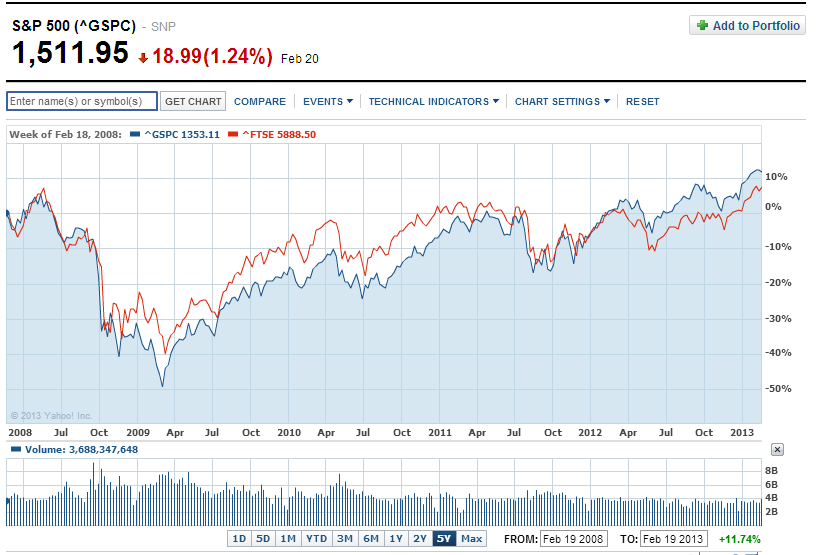
Source: Yahoo Finance
S&P 500 vs. FTSE 100 – 10 Year Return:
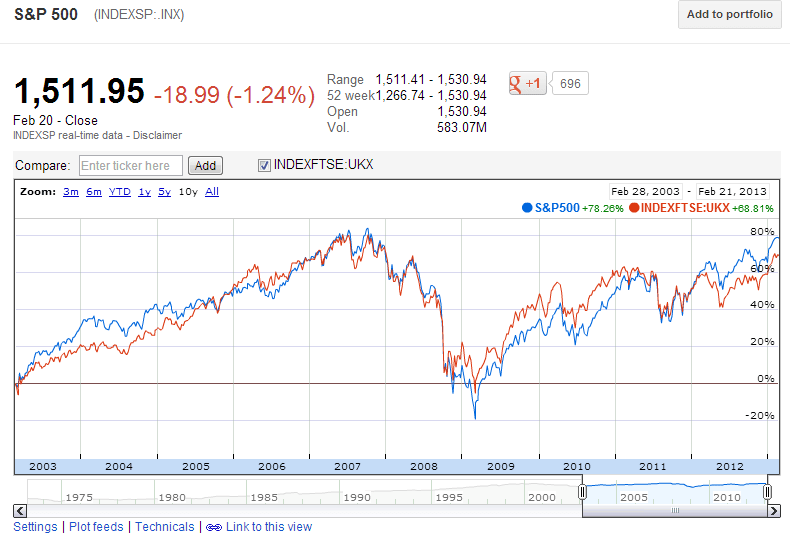
Source: Google Finance
Source: “Lost decade” a myth for equity income investors, FE Trustnet
Related ETFs:
iShares MSCI United Kingdom Index (EWU)
SPDR S&P 500 ETF (SPY)
Disclosure: No Positions


