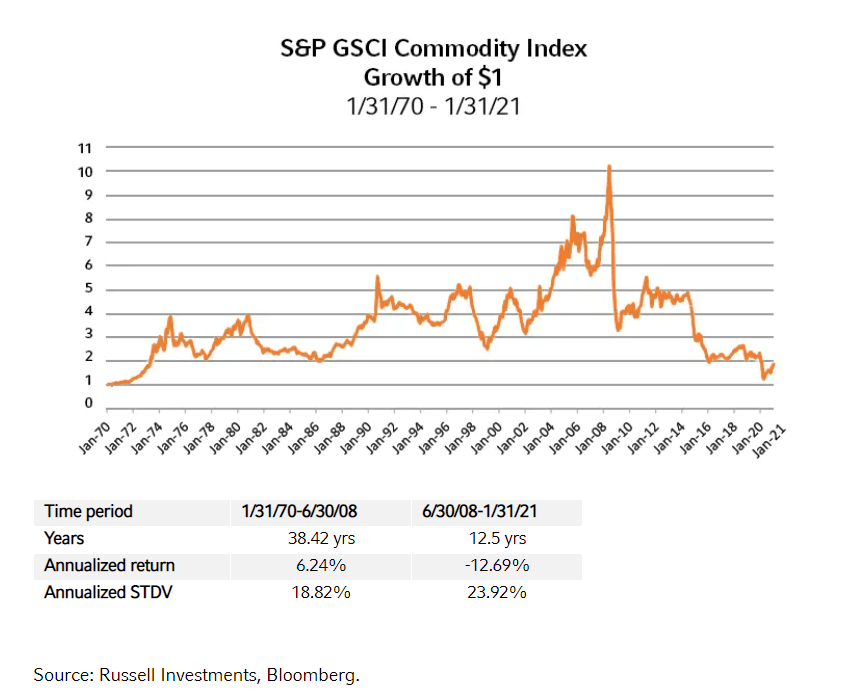
The following chart shows the price of an index of commodity prices from 1800:
Click to enlarge

Source: Quarterly Commentary 2, Allan Gray Investment Management, South Africa
Despite the rise in commodity prices in the past two decades the long-term trend is still down. According to the author of the report, over the past two centuries human ingenuity has found new and efficient ways to produce and use commodities. A more recent example is the development of technology to extract America’s shale gas reserves.
Related ETFs:
iShares GSCI Commodity-Indexed Trust (GSG)
United States Commodity Index Fund (USCI)
PowerShares DB Commodity Index Tracking Fund (DBC)
Disclosure; No Positions