The charts below the returns on different types of asset classes from 1995 thru 2009:
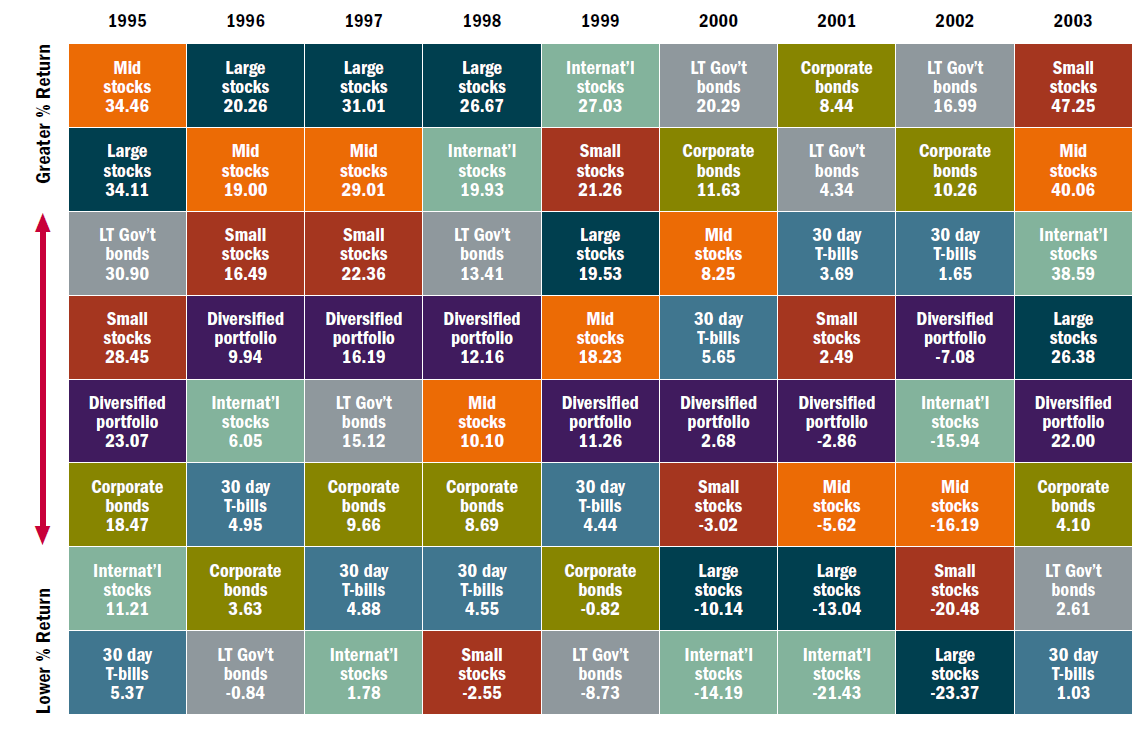
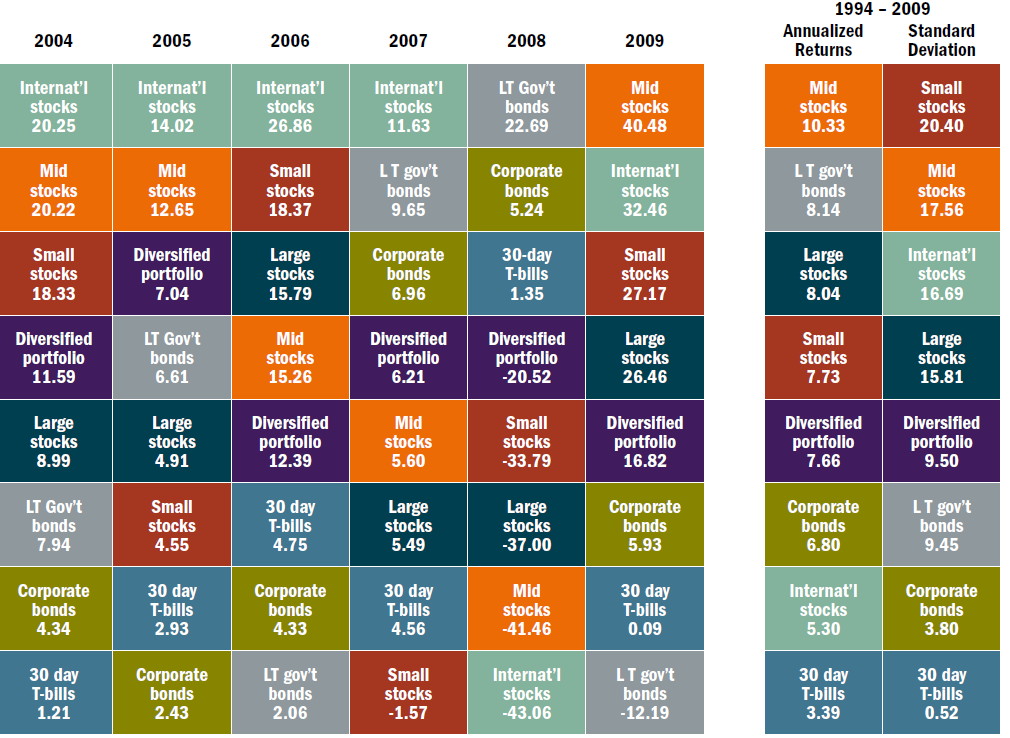
Some takeaways from the charts:
- For four years since 2004 foreign stocks were the best performers.
- In the 2008 credit crisis foreign stocks were the worst performers with a loss of about 43%.
- Last year they yielded the second best returns after US mid-cap stocks.
- Since 2003 international stocks have yielded double-digit returns each year except 2008.