The S&P 500 Index that is benchmark of US equities is a price index – meaning dividends are not included in the return calculations. Since this index is the most popular and reported by the media all the time, investors may use this index to compare their portfolio performance. This is not the correct way to benchmark one’s portfolio return against an index. Assuming an investor reinvests dividends the better way to measure the performance of US stocks is to use the S&P 500 Total Return Index which includes dividends reinvested.
Of the 500 companies in the index, 425 paid dividends at the end of 2015, So when these dividends are reinvested the return will be higher over the long-term due to the effect of compounding. The difference between the S&P 500 Price Index and Total Return can be substantial over many years such as 5 years as shown in the chart below:
Click to enlarge
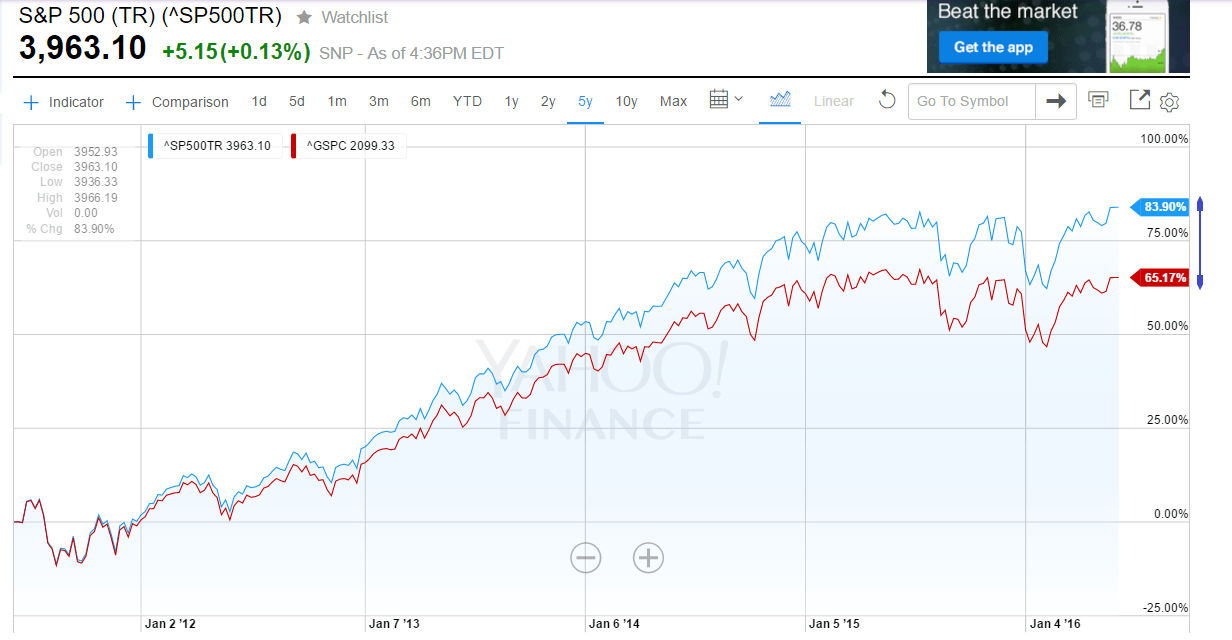
In the past 5 years, the price index returned 65% compared to the total return index return of about 84%. That is a gap of 19%.
Over 10 years the difference in returns is even higher.
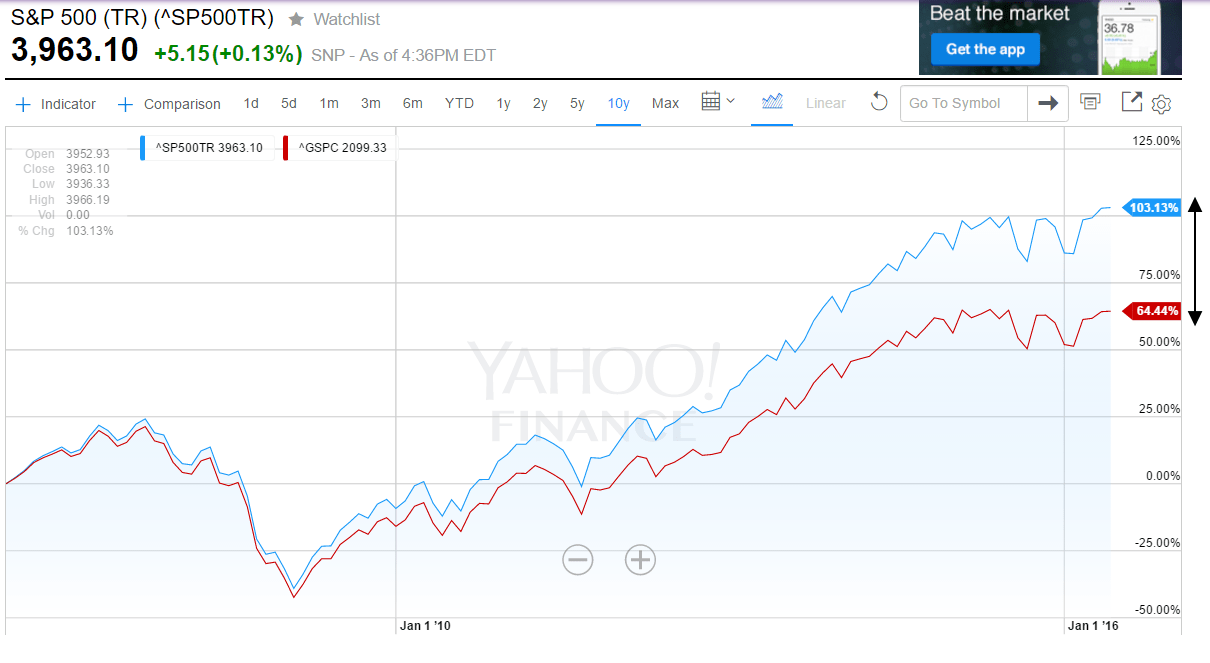
Source: Yahoo Finance
Here is another chart showing the returns from 1988 thru mid 2013:
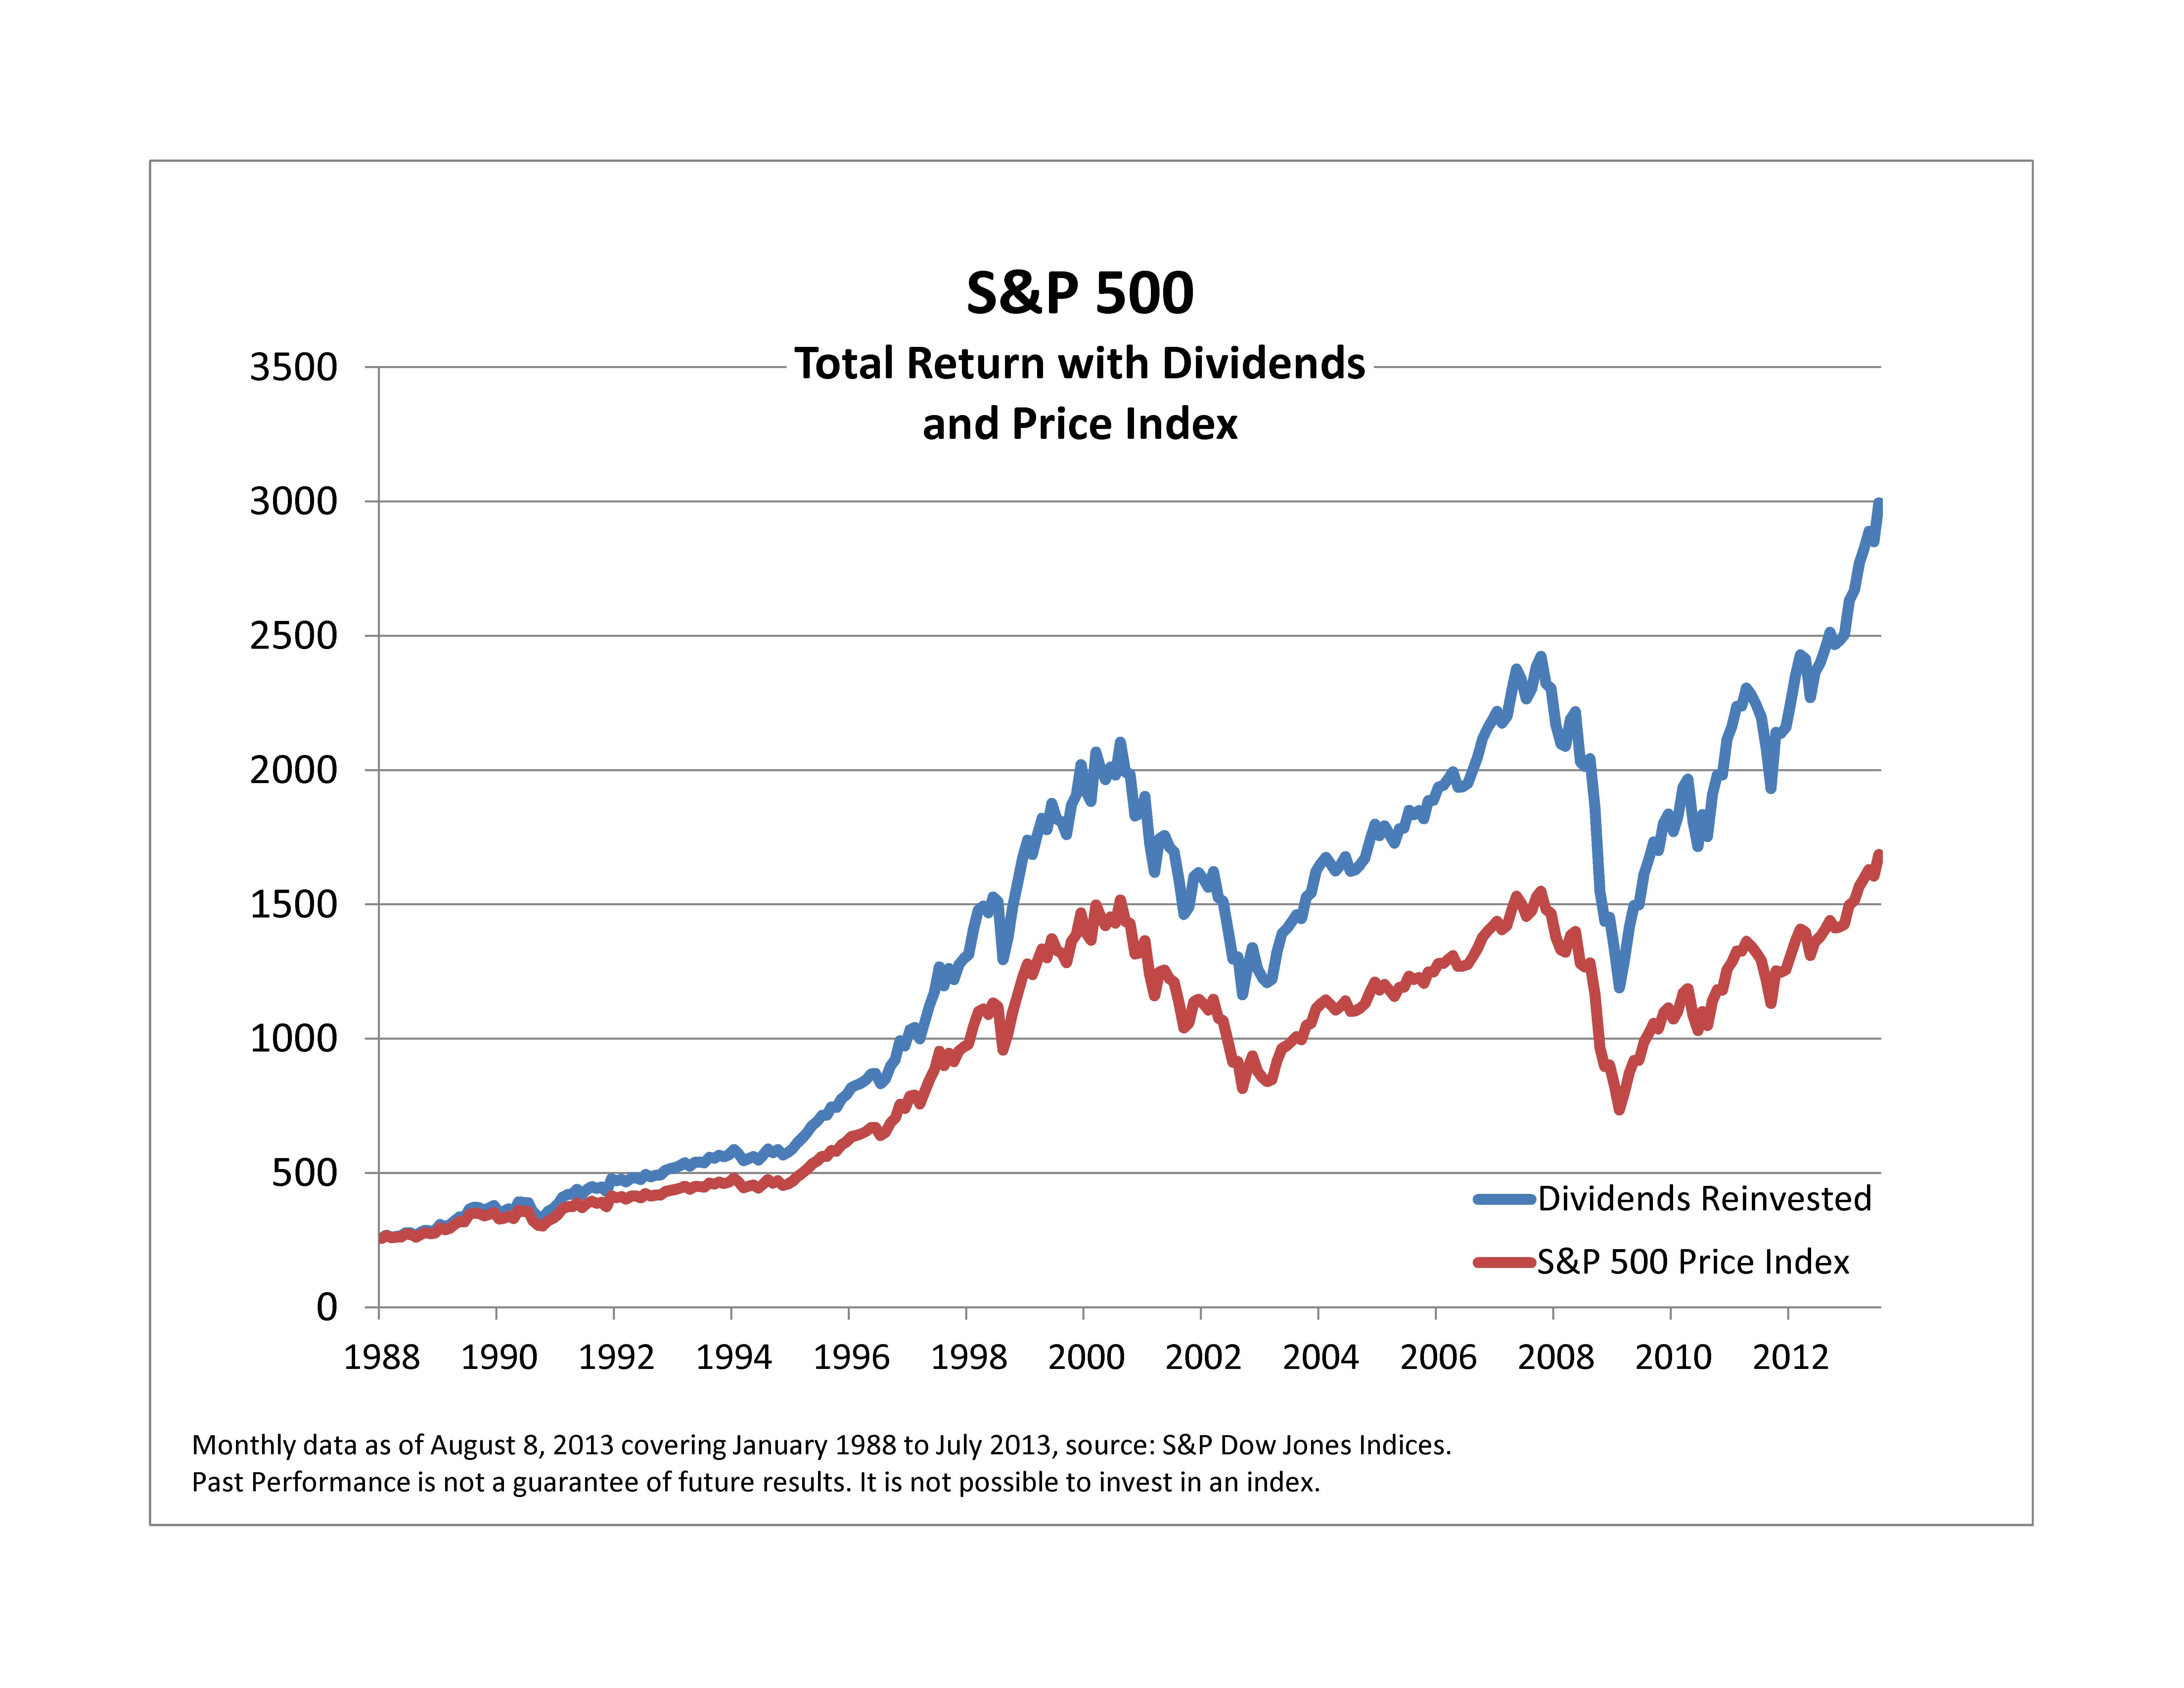
Source: Inside the S&P 500: Dividends Reinvested, S&P Indexology Blog
Related ETF:
- SPDR S&P 500 ETF (SPY)
Unfortunately there is no ETF that tracks the S&P 500 Total Return Index.
Disclosure: No Positions