Every year Callan Associates publishes their famous Callan Period Table of Investment Returns. Recently they updated the table with data for the year 2012.
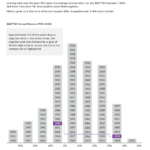
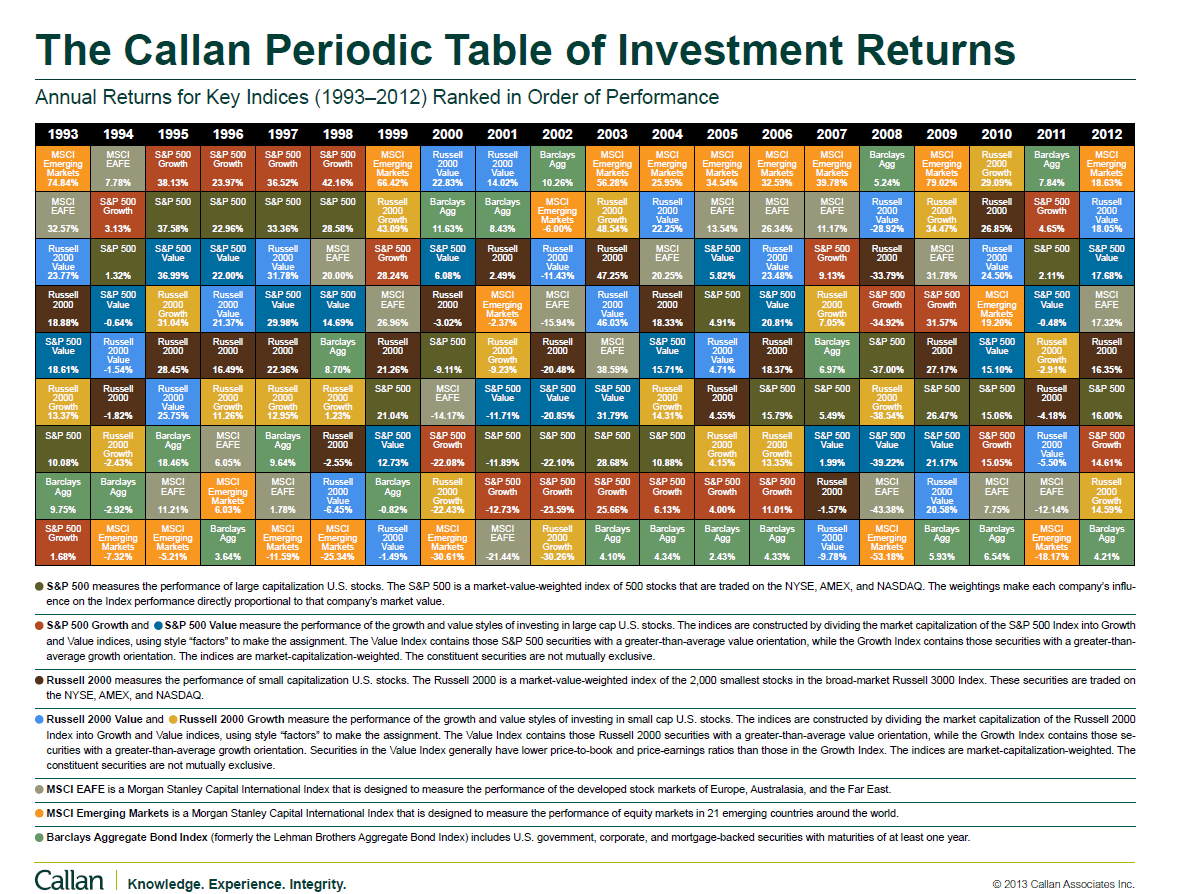
The Callan Periodic Table of Investment Returns for 2012 is shown below:
Click to enlarge
Source: Callan Associates
Some interesting observations from the table are:
- In 2012, the emerging markets beat U.S. with a return of over 18.0%.
- Compared to a return of just over 2.0% in 2011, the S&P 500 shot up 16.0% last year.
- Bonds yielded just over 4.0% as measured by the Barclays Aggregate Bond Index.
- The Russel 2000 Value index which is an index of small cap stocks beat large caps.
- Despite wild volatility, emerging market stocks have been the best performers in the last decade.
The Callan Charts for 2011 here.
The charts for 2009 and 2010 can be found here and here.
Related ETFs:
- iShares MSCI Emerging Markets ETF (EEM)
- Vanguard Emerging Markets ETF (VWO)
- SPDR S&P 500 ETF (SPY)
- SPDR STOXX Europe 50 ETF (FEU)
- SPDR DJ Euro STOXX 50 ETF (FEZ)
- iSharesiBoxx $ Investment Grade Corporate Bond Fund (LQD)
- iSharesBarclays US Aggregate Bond Fund(AGG)
- Vanguard Total Bond Market ETF (BND)
Disclosure: No Positions
Related: The Callan Periodic Table of Investment Returns 2016: A Review