Unibanco Stock Split 2008

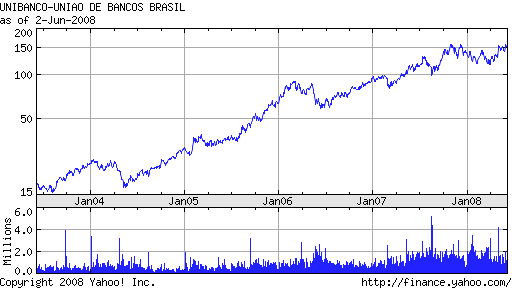
Uniao De Bancos Brasileiros S.A. of Brazil proposes to split its ADR stock UBB in the ratio of 5:1 and also issue a bonus stock of 10%.

The above decision was made in a meeting on May 29th.The proposal has to be approved by the board and the Brazilian Securities Exchange Commission before it can become effective. The Record Date has not been set yet.

The bank will also issue 10% bonus stock to all existing shareholders as part of the increase in capital stock of the bank.

Split Details
Company: Uniao De Bancos Brasileiros S.A.
Ticker: UBB
Current Price/Share:$146.42 (As of June 4,2008)

Split Ratio: 5:1
Bonus: 10% stock bonus
Record Date: Not announced yet

For more details on the May 29th announcement click here: UBB Stock Split News

After the split, UBB’s liquidity will increase since there are already 280M shares outstanding.

Brazilian Bank ADRs

There are 5 large private banks in Brazil.Out of these, three trade as Depository Receipts (DRs) in the US. They are:

1. Banco Bradesco S.A (BBD)
2. Banco Itau Holding Financeira S.A. (ITUB)
3. Uniao de Bancos Brasileiros S.A. (UBB)

Profile and Key Points (All data as of June 2,2008)

1. BBD:
Bradesco Bank is the largest private sector bank in Brazil with more than 2900 branches.

BBD has yield of 0.82%.It pays monthly dividends.P/E ratio is 17.54 and the 5-year Earnings Growth is 19.57%. BBD has a high payout ratio.In 2007, it paid out 37.10%
of Net Income.BBD stock split 3:2 last month.

A $10,000 investment 5 years ago would be worth $130,100 as of May 31,2008 (Source: S&P Quantitative Stock Report).

5-Year Chart:

bbd

2. ITU:
Itau Bank is the second largest private bank in Brazil with Head Quarters in Sao Paulo and 50,000 employees.

ITU has yield of 1.79%.Just like BBD, it also pays monthly dividends.The 5-year Earnings Growth is 24.87%.The 12-month Trailing P/E is 15.8.

A $10,000 investment 5 years ago would be worth $107,366 as of May 30,2008 (Source: S&P Quantitative Stock Report).

5-Year Chart:

itu

3.UBB:
Unibanco is the 3rd largest private bank in Brazil with Head Quarters in Sao Paulo.

UBB’s dividend yield is 2.72%.Beta is 2.1. The 5-year Earnings Growth is 24.87%.The 12-month Trailing P/E is 23.1.

A $10,000 investment 5 years ago would be worth $110,484 as of May 30,2008 (Source: S&P Quantitative Stock Report).
*** On May 29 Unibanco announced that it proposed to split its stock in the ratio of 5:1 and also issue a 10% stock bonus. ***

5-Year Chart

ubb

Sources:
http://www.bradesco.com.br/ri/eng/
http://ww13.itau.com.br
http://www.ri.unibanco.com.br/ing/hom/index.asp

Ultrapar and Imperial Oil

In this post,lets look at two fuel distributors.One is Ultrapar Holdings Inc. (UGP) from Brazil and the other is Imperial Oil Ltd. (IMO) of Canada.

1.Ultrapar distributes Liquefied Petroleum (LPG) in Brazil.LPG is used for cooking and other purposes.UGP also produces various kinds of chemcials and engages in the transportation and distribution of the same.


Details (As of June 1st, 2008):
Company: Ultrapar Holdings Inc.
Country: Brazil
Ticker: UGP
Price per share: $38.01
Dividend Yield: 5.38%

5-Year Chart:


2.Imperial Oil Ltd operates in crude oil, natural gas and chemical industries. Specifically the company runs the “ESSO” brand gas stations in Canada.It is called so because IMO is a subsidiary of Exxon Mobil Corporation. ESSO stations are distributed throughout Canada.


Company: Imperial Oil Ltd
Country: Canada
Ticker: IMO
Price per share: $57.53
Dividend Yield: 0.59%

5-Year Chart:

European Utilities Vs. US Utilities

Goal: Compare European Utilities Index and US Utilities and determine which one is better for long-term investment.

Solution: Perform a comparison using utility indices specifically the iShares Dow Jones U.S. Utilities Sector Index Fund (IDU) ETF for US and Lyxor ETF DJ Stoxx 600 Utilities Fund for Europe. IDU is a proxy for U.S. Utilities Index and the Lyxor ETF is a proxy European Utilities. IDU is in US$ while the Lyxor Fund is in Euros.

Analysis:
IDU has 76 US stocks representing Electricity and Gas,Water & Multi-Utilities.Exelon Corp., an electricity utility is the top holding in the portfolio(about 10%). The fund was started in June 2000 and has a total net assets of $866+ Million.The dividend yield is 2.69% and the expense ratio is 0.48%

The Lyxor fund has 32 stocks with an asset base of about 63M EUR and the the expense ratio is 0.30%.Multi-utilities represent about 46%,Electricity at 37%,Gas at about 7% and Water at about 6% in the fund.The Reuters ticker for this fund in the Paris Exchange is LYXUTI.PA. The top 3 countries in the fund are Germany(27%), France(22%) and UK(20%).

The 5 year performance of the two funds are listed in the table below:

[TABLE=54]

We see that the European Utilities performance is better than their US counterparts in each year except in 2008 to-date. Excluding this year, the average annual return for the past 4 years for US utilities is 18.77% whereas the same for the European utilities is 26.01%. That’s a difference of over 7%.This is a big difference and kinda surprising since utilities in the US pay dividends quarterly and there is a lot more competition than Europe where companies pay dividends semi-annually and companies are regulated heavily.

The DJ Stoxx 600 Utilities index returns are as follows (in EUR):
YTD: -9.14%
3 Years: 64.78%
5 Years: 148.40%

Note: All data as of June 1, 2008

Sample European Utility Returns:
Enel:
From 01/02/2004 to 05/30/2008 Enel returned an annual yield of 14.81%.
This includes all splits and dividends reinvested.
Source: Enel Corp Site

EON:
A 1000 EUR invested in 01/02/2004 will be worth EUR 2,628.49 on 05/30/2008.That’s a growth of 162.85%.This includes all splits and dividends reinvested.
Source: EON Corp Site

Conclusion:
This simple analysis shows that European utilities are a better investment than US utilities.Of course the analysis has issues such as not taking into account currency exchanges and other factors.However any investor looking for above average returns with the utility sector might want to invest some in European utility stocks.

Components of DJ Stoxx 600 Utilities available as ADRs in the US are
as follows:

[TABLE=55]

Related Links:
1. Lyxor Utilities ETF Factsheet
2. iShares IDU page
3. DJ Stoxx 600 Utilities Index
4. ETF Connect – IDU Page
5. DJ Stoxx 600 Euro Utilities Components