No Bank Failures in Australia in Modern Era

According to the Australian Bankers Association, “Australia has not had a thorough bank failure in the modern era*, and so has not experienced the fallout from a collapse first-hand.”

However other countries have had their share of bank of bank failures. Some examples are:

1970

USA

US Penn Central Bank – collapse of market liquidity

1974

Germany

Herstatt – bank failure following foreign exchange trading losses

1984

USA

Continental Illinois Bank – failure following loan losses

1985

Canada

Regional banks – failures following loan losses

1993

France

Credit Lyonnais Bank – crisis

1995

UK

Barings Bank – collapse due to trading losses

1995

USA

Daiwa Bank – record trading losses

1996

Japan

Banking system – crisis following loan losse

In all the above cases depositors lost money or taxpayers had to subsidize the loss.

*Bank failure is here defined as an episode where ordinary depositors lose their money. It is recognized that Australian banks have gone through periods of turbulence. The late 1980s and early 1990s was a transitional period characterized by volatility. The State Banks of South Australia and Victoria collapsed. The loss of public confidence took its strongest turn when Pyramid Building Society went into insolvency, costing the Victorian Government $900m to bail out. Credit Union and Friendly Societies also faced problems. That said, the fact remains that Australia has not faced widespread social dislocation as a result of a financial crisis since at least the 1890s depression.

Source: Australian Bankers Association

Three Australian banks trade in the US markets. One of them in the NYSE and the other two in the OTC exchange.

1. Westpac Banking Corp – WBK
Current Yield: 7.92%

2. Australia & New Zealand Banking Grp Ltd – ANZBY
Current Yield: 10.32%

3. National Australia Bank Ltd – NABZYCurrent Yield:10.28%

The iShares MSCI Australia ETF (EWA) provides exposure to many Australian equities.

Listing Of Shutdowns At Europe’s Car Assembly Plants

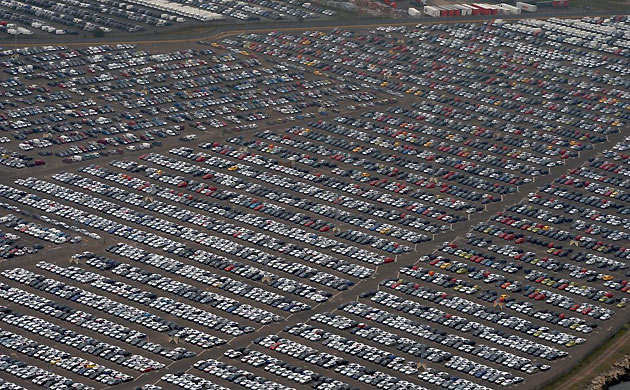
In response to falling sales many car makers around the world have announced temporary shutdown of their assembly plants. The severity of the situation was evident from the recently published photos of unsold new cars parked in ports, factories, etc. in various countries. A sample photo is shown below.

New Cars parked

Photo: Imported cars stored at Sheerness open storage area awaiting delivery to dealers
Credit: David Goddard/Getty
Source: The Guardian, UK

For more photos go to: Growing stocks of unsold cars around the world

As ports and other places struggle to keep up with the unsold inventory, car makers in Europe have announced shutdowns of a few days to two months or more. A study by the Policy Department of the European Parliament compiled the various factory closings in Europe.

Listing of Shutdowns of Major Vehicle Assembly Plants in Europe

(click to enlarge):

Car Assembly Plant Shutdowns in Europe

Car Assembly Plant Shutdowns in Europe

In addition to car makers, auto parts suppliers have also been affected. Some of them have announced temporary closings of their plants as shown below:

Car Assembly Plant Shutdowns in Europe

Source: Impact of the Financial and Economic Crisis on European Industries,Policy Department Economic and Scientific Policy, March 2009, European Parliament

European car makers deal with over 800 suppliers procuring parts worth about 30B Euros per year.

According to the paper mentioned above, at this stage of the recession, “even a marked improvement in availability of vehicle financing now would not prevent the market falling heavily for the rest of the year”.

Knowledge is Power: Ten Great Wines Edition

1. The financial crisis and economic downturn are likely to put upward pressure on government debt. The trouble is, according to OECD in Figures 2008, public debt (general government debt, which includes central and local government) had already risen quite sharply in the OECD as a whole since 1987, from 59% of GDP to 75% in 2007. Two decades ago, Belgium had the highest public debt, but today that position is filled by Japan, whose debt rose from below 60% to 170% of GDP. Italy’s debt has also shot above 100% of GDP in the past 20 years. Debt burdens

2. The U.S. Postal Service has already suggested dropping a day of mail delivery to save money. Now, with economic gloom everywhere, it’s turning to early retirements, management cutbacks and office closings.US Post Service looks for new ways to cut losses

3.Denmark is confirmed as the OECD’s highest-tax country, followed by Sweden, while Mexico and Turkey remain the lowest-taxing countries, the latest 2008 edition of Revenue Statistics says. Denmark’s tax-to-GDP ratio stood at 48.9% in 2007, while Turkey’s was at 23.7% of GDP. Tax burden nears peak

4.Does less-invasive winemaking result in a more flavorful drink? Try these bottles to see for yourself. Ten Great Unfiltered, Unfined Wines to Try

5.More mutual-fund firms such as Vanguard Group are set to raise their fees in response to stocks’ plunge, signaling a tough year ahead.Funds hike fees, adding to investors’ pain

6.Aim is to bolster member states outside the euro zone — including Hungary, whose prime minister offers to step down Saturday.E.U. doubling crisis fund

7. The Wall Street Journal issued a story that appeared to rely on a single source “a person familiar with the data said” and Bloomberg, apparently unable to corroborate the leak, repeated key bits of the Journal article, with attribution. WSJ: Chinese Imports, Exports Continued to Fall in December

How Bad Is Mortgage Delinquencies In Canada?

On March 5, the Mortgage Bankers Association announced that mortgage delinquencies continued to rise in the US. The press release said “The delinquency rate for mortgage loans on one-to-four-unit residential properties rose to a seasonally adjusted rate of 7.88 percent of all loans outstanding as of the end of the fourth quarter of 2008, up 89 basis points from the third quarter of 2008, and up 206 basis points from one year ago”. The percentages of loans that were 60, 90 days or more past due also set new records in 4Q,2008 compared to 3Q,2008.

How does the mortgage delinquency rate in Canada compare to the US rate of 7.88%?

A review of the data from the Canadian Bankers Association shows that the delinquency rate in Canada is much lower than the US rate. Though the data shown in the below table goes only up to October of 2008, it still provides some interesting insight to analyze mortgage delinquencies in Canada.

Number of Residential Mortgages in Arrears

[TABLE=145]

Source: Canadian Bankers Association

Note:Includes data from BMO(BMO), CIBC(CM), HSBC Bank Canada, National Bank of Canada, RBC Royal Bank(RY), Scotiabank(BNS), TD Canada Trust(TD) and Manulife Bank. Mortgage arrears means delinquencies of 3 months or more.

As seen in the above table, mortgage delinquencies in Canada as of October, 2008 stood at just 0.29%. This is much below the 7.88% figure in US reported by the Mortgage Bankers Association. While the Canadian rate increased from 0.27% in the beginning of 2008 to 0.29% in October, it is still below 1% of all outstanding mortgages. Data for the last two months of 2008 is not yet available in the site. As the Canadian economy weakens further it will be interesting to see impact on the mortgage delinquency rate in the coming months.

Savings Rate in US Since 1980

On February 10, I wrote about savings rate in the US in the article How High Will The US Personal Savings Rate Go?.

As a follow up to that piece, here is a chart showing household savings in the UK, USA, France, Germany and Japan since 1980:

US Savings Rate since 1980

Source: The Global Economic Crisis: Systemic Failures and Multilateral Remedies, UNCTAD (United Nations)

In the above research paper, UNCTAD says:

“Without the high level of consumption in the United States, today most of the developed world and many emerging-market economies would have much lower standards of living, and unemployment would be much higher.”

With regard to the economic growth in the US and UK, the paper says:

“Indeed, the consumption boom in the United States since the beginning of the 1990s was not well funded from real domestic sources. To a significant degree it was fuelled by the speculative bubbles that inflated housing and stock markets. The “wealth effect” of higher prices for housing or stocks led households in the United States and in the United Kingdom to borrow and consume far beyond the real incomes that they could realistically expect, given the productivity growth of the real economy and the dismal trends in personal income distribution. With overall household saving rates to close to zero (figure 1.1) consumer demand in both countries expanded rapidly but at the same time the growth process became increasingly fragile because it meant that many households could only
sustain their level of consumption by further new borrowing. ”

The graph above clearly shows that the savings rate in the US deteriorated overtime from 10% in 1980 to reach 0% in 2004. The French and the Germans save about 15% of their disposable income. Interesting to see that in the past few years savings level in Japan has fallen below that Germany and France.