Knowledge is Power:Shipping Industry Crisis Edition

Shipping-Collapse

 Source: Der Spiegel

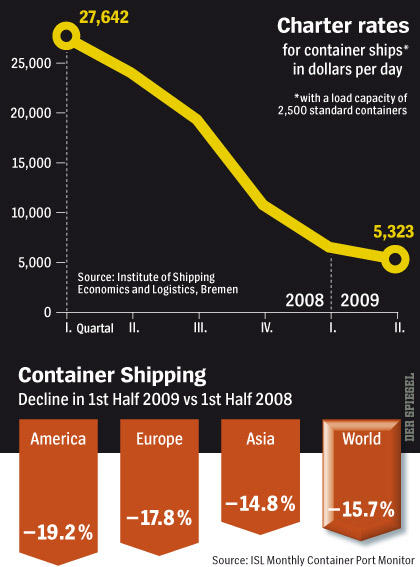
The global economic crisis is wreaking havoc on shipping: Demand and prices have collapsed and ports are filling up with fleets of empty freighters. The crisis has fueled cut-throat competition and not all companies will survive. Germany’s Hapag-Lloyd alone needs 1.75 billion euros to stay afloat.Shipping Industry Fights for Survival

The number of bankruptcies rose by a staggering 51.6 per cent in June compared to the year before, as more Canadian consumers and businesses were…Canadian bankruptcies skyrocket in June

Will the current crisis reverse the past two decades of democratisation and financial liberalisation? This column documents the complex, non-linear relationship between political and financial reform. Financial liberalisation often reverses as countries move from autocracy to democracy, as “partial democracies” are less liberalised, and there are big differences between de jure and de facto liberalisation.Financial liberalisation and “partial democracy”

Even some of our most sophisticated commentators doubt a link between consumer protection and any macroeconomic outcomes.  Consumer protection, in this view, is microeconomics and quite different from macroeconomic issues (such as the speed and nature of our economic recovery).Credit Conditions In The Absence Of Consumer Protection

The order in which the world will emerge, post-recession, is still unclear, but a long slog can be expected, after which there will still be few competitors to challenge the US dollar as the world’s predominant currency.How will the world look when the dust settles?

The balance of risks to Asian equities is to the downside over the next three months, says Macquarie.Macquarie bullish on Singapore and banks

Stronger high-street sales and optimism in housing market have boosted hopes of economic recovery. Spending and house prices pick up

Ships-Parked

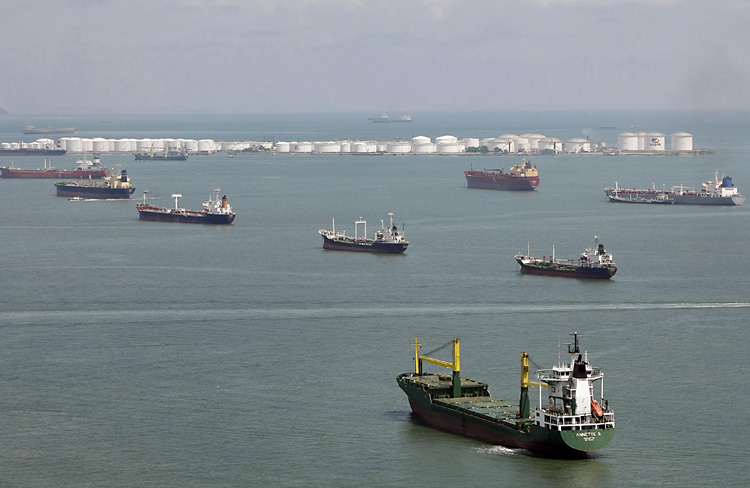
Container ships and bulk carriers parked off the coast of Singapore: Roughly 450 container ships are now idle worldwide as a result of the crisis — about 10 percent of the global fleet. Credit: Der Spiegel

Brazil’s Current Economy in Charts

Emerging markets are once again the hot destination for investors this year. Brazil continues to be a favorite destination for foreign capital. The central bank of Brazil, Banco Central Do Brasil recently released the “Brazil’s Economic Chart Pack” showing  a snapshot of the current state of the economy.

Some of the interesting charts are presented below:

1. The Public Sector Net Debt trend is down. In 1Q,2009 net debt stood at 37.6% of GDP

Brazil-Debt

2.Brazil has a trade surplus as shown in the chart below

Brazil Trade

3.More than half all Brazil’s  exports is for emerging market countries. The U.S. accounts for just 13.2% of Brazil’s exports

brazil-trade

4.Only about 40% of exports are primary products which consists of iron ore, food, oil and tobacco. Manufactured goods total about 45%. These include buses, cars, tractors, planes, etc. Hence contrary to popular belief,Brazil is not just a commodity exporter. Nearly half of all exports are finished products.

Brazil-Exports

5. Unlike in the U.S. and Western Europe, credit growth is actually higher this year in Brazil. Consumers and Corporates increased credit by 18.7% and 22.7% year-over-year for April this year.

Brazil Credit Growth

Source: Banco Central Do Brasil

Related:

ETF:  iShares MSCI Brazil Index (EWZ)
Banco Bradesco (BBD)
Itau Unibanco Holding SA (ITUB)

What are the Best and Worst Performing Foreign Bank ADRs YTD?

The S&P; 500 Index is up 11.87% as of August 7, 2009. The Financials in the index are up 14.43%. However many of the foreign banks have risen considerably higher in the recent run-up in global markets. In fact many of the foreign bank ADRs are up over 50% Year-To-Date (YTD).

Three foreign banks have performed exceptionally well in terms of share price increase. They have grown over 100% YTD. These 3 banks are:

Woori Finance (WF)
YTD Change = 148.56%

Barclays Bank (BCS)
YTD Change = 146.33%

Bank of Ireland (IRE)
YTD Change = 142.56%

Woori Finance of South Korea is the best performing ADR YTD. South Korea’s economy is rebounding well. Today the IMF upgraded South Korea’s economic forecast and suggested that the economic growth will contract by 1.8% instead of 3.0% projected earlier. Barclays weathered the credit crisis better and emerged much stronger than its peers in the UK.

Two foreign banks are still in the negative territory YTD. These 2 banks are:

Lloyds Banking Group(LYG)
YTD Change = (5.19%)

Mizuho Financial (MFG)
YTD Change = (17.68%)

Llyods Bank of UK is suffering due to its acquisition of Britain’s largest mortgage lender HBOS plc last year.The Royal Bank of Scotland (RBS), another bank that was killed in the credit crisis is up just 5.60% so far this year. In addition to subprime, derivatives related writedown RBS also incurred heavy losses due to its ill-timed takeover of ABN Amro in partnership with a few other large banks. Clearly investors are sifting thru the rubble after the credit crisis and picking up stronger banks that can survive thru adverse economic conditions.

Six Large Cap ADRs With > 5% Dividend Yield

To find the ADRs with the largest market cap and best yields, I ran the stock screener with the following conditions:

Stock Type = ADRs
Exchange = NYSE
Dividend Yield = 5%+
Market Cap = $100B+

The search resulted in 6 stocks noted below:

Company: Royal Dutch Shell plc (RDS.A)
Country: U.K.
Sector: Oil
Dividend Yield: 6.48%

Company: BP plc (BP)
Country: U.K.
Sector: Oil
Dividend Yield: 6.57%

Company: TOTAL S.A.(TOT)
Country: France
Sector: Oil
Dividend Yield: 5.95%

Company: Banco Santander, S.A.(STD)
Country: Spain
Sector: Banking
Dividend Yield: 5.35%

Company: Telefonica S.A (TEF)
Country: Spain
Sector: Telecom
Dividend Yield: 5.47%

Company: Vodafone Group Plc (VOD)
Country: UK
Sector: Telecom
Dividend Yield: 8.04%

Just one bank from Europe is in this list. The rest of them are either oil or telecom companies. These two sectors have remained strong during the credit and crisis and have since rebounded nicely. Telecoms for example have stable revenue generating traditional land line business. Other areas such as wireless, voice, data, etc. add more income. Similarly oil companies pro fitted heavily last year when crude oil prices reached stratoshperic levels. Royal Dutch Shell, BP and Total are multinationals with operations in many countries.

Buy-and-Hold Strategy Still Works

During the past few months, many investors came to the conclusion that buy-and-hold strategy does not work anymore. However there are some folks who still believe that the strategy still works provided one chooses the right mix of investments for a portfolio and holds it over a long period of time.

The following two charts show buy-and-hold strategy can produce incredible returns over 39 years with the right mix of assets:

Stock Portfolio

Stock Portfolio-2

Source: The Ultimate Buy-and-Hold Strategy – 2009 Update, Paul Merriman, Founder of Merriman.

To read the full article, click here.