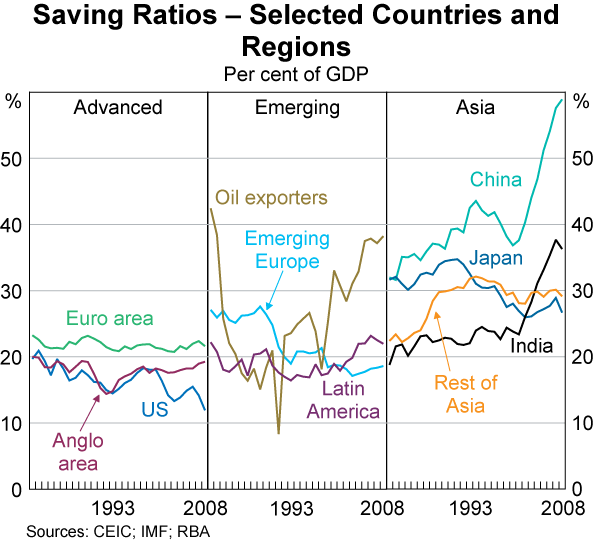
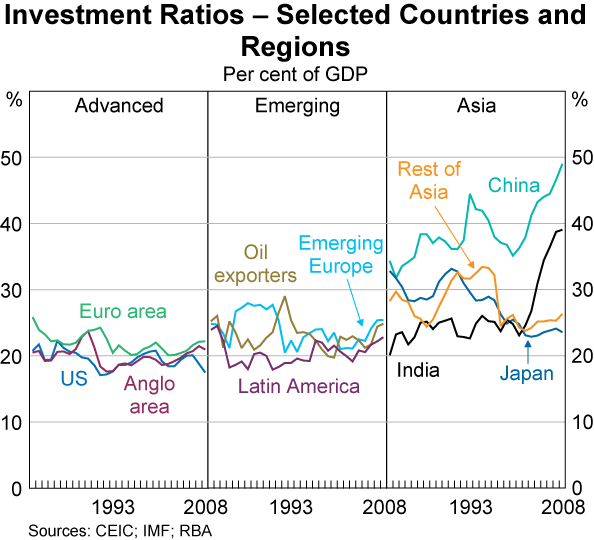
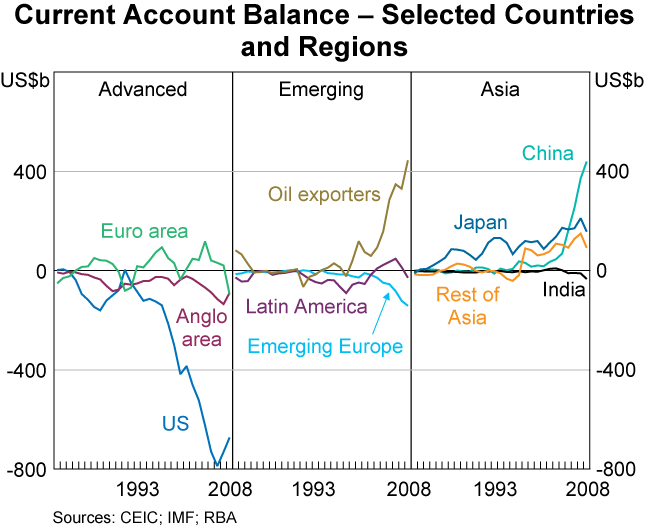
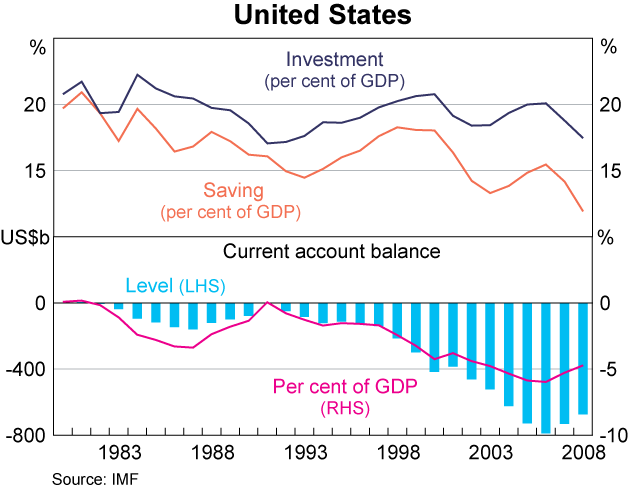
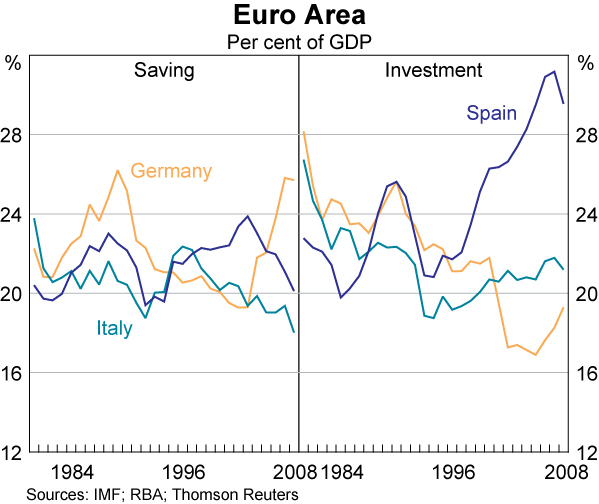
China is the second largest trade partner of the U.S.. Total trade with China amounted to $194B with the U.S. running a trade deficit (imports greater than exports) of $123B as of July this year. In fact, the U.S. has been running a trade deficit with China for many years now. In recent years however, the deficit gap has widened. As trade with China grew exponentially over the years, the trade deficit zoomed from just $6M in 1985 to $268B in 2008.
Last U.S. merchandise trade with China amounted to $405B. This represented about 12.4% of U.S. merchandise trade with the world.
US Exports to China in 2008 = $67.2 B
US Imports from China in 2008 = $338.0 B
This resulted in a merchandise trade deficit of $270.80 B with most of these goods ending up in US households.
In 2008, the top US exports to China were soybeans, computer chips, passenger airplanes, and copper and aluminum waste and scrap. The top imports from China were computers and their parts, wireless telephones, toys, and video games and their parts. In the services trade with China, the U.S. had a trade surplus of $6.2B.
China accounted for just 6% of the leading U.S. merchandise export markets in 2008 as the graph shows below:
But US imports from China amounted to 16% of total imports. China alone accounted for 29.4% of the total merchandise deficit of $920B in 2008. The trade deficit was not large with our biggest trade partner Canada.
Source: THE YEAR IN TRADE 2008, U.S. International Trade Commission
On the services part of the U.S. trade, China accounted for just 3% of total U.S. exports in 2008 which is much lesser than the services trade with Mexico and Canada. Total U.S. exports to China as a whole has grown by more than 300% since 2000. The chart below shows the growth of U.S. exports till 2007:
Source:
CHINA AND THE US ECONOMY:ADVANCING A WINNING TRADE AGENDA,
Recommendations for the New Administration and Congress, January 2009
The US-China Business Council
In 2008, the U.S. was China’s top destination for exports but the top three countries from where China imported goods and services were the Asian countries of Japan, South Korea and Taiwan. The U.S. was the fourth largest import supplier to China with a total value of $81.4B.
A few interesting points from the US-China Business Council Report and my views on them:
“The US economy dwarfs China’s. The United States added nearly two Chinas to its economy in the past decade. China is rapidly developing, but the United States has a much stronger foundation from which to build. In fact, the US and Chinese economies are greatly interdependent and need each other to succeed. ”
This is correct. Obviously the U.S. economy is a much larger economy than China’s. However the Chinese economy is growing faster than the U.S. economy. I do not believe that the US and Chinese economies are interdependent and need each other. They are inter-dependent now because it has been setup that way in the past few decades as US manufacturing shifted to take advantage of cheap labor and loose regulations in China. The Chinese economy needs the U.S. more than the US economy needs China’s. This is because before the 1980s the US economy did not depend much on trade with China and can easily grow without China. If the Chinese decide become a closed economy like in the past, the U.S. can import the goods it needs from other countries which would be more than willing to replace China as America’s largest trade partner. Mexico, Philippines, Vietnam, Brazil are some of the countries that would be happy to expand their manufacturing base to satisfy the American demand for cheap goods.
“US manufacturing faces an array of challenges, but China is not at the top of the list. The US share of global manufacturing output has been consistently above 20 percent since 1982. China is increasing its global manufacturing position, but it is primarily taking share from Japan and others in East Asia.”
The report argues that China simply took more manufacturing from other Asian countries such as Taiwan, Japan, South Korea, etc. It uses the example of Sony TV which used to be “Made in Japan” and sold in the U.S. Now the Sony TV would have the label “Made in China” since many Japanese manufacturers shifted production to China. While true, this examples does not answer the whole story. There are many more manufacturing sectors where U.S. based well-paying jobs disappeared in the last few decades. Besides the Japanse have always been a leader in consumer electronic goods.
“US services exports to China are growing and hold the potential to get even stronger. The United States has a services trade surplus with China, supporting high-quality, high-wage jobs in the financial, logistics, and legal sectors, to name a few.”
Growth in services export to China is highly unlikely to equal the growth in exports of goods or the imports of goods from China. While in the initial few years, the Chinese may depend on American services and technology such as nuclear technology for example, later on the Chinese will perform those services themselves and will not need the services of foreign companies. The report cites major US banks and financial institutions, law firms, business advisory, etc. as some examples of the services sector that has the potential to grow as the Chinese economy grows. It is true that these sectors have high- quality, high-paying jobs but they will not replace the millions of jobs lost in the manufacturing sector. A law firm, a consulting company or an investment firm will not need thousands of American workers to provide services in China. Besides some of these firms may establish branches in China and hire local labor to supplement a few American workers and provide services at a cheaper cost.
“Most of the answers are here at home. To succeed in the years ahead, we need smart policies on energy, healthcare, education, and innovation to maintain the competitive leadership of American companies and workers.”
The above point can easily be disproved. The Obama administration is investing heavily in green energy, health-care, education, etc. hoping that they would create millions of jobs and pull the U.S. economy out of this recession. This strategy will not work since these sectors will never produce well-paying, high-quality jobs that American workers need. Healthcare and education are highly regulated sectors and do not require millions of additional workers to cater to the needs of the current population. For example, there are already more universities and highly educated professionals than needed by the economy.
After hitting lows in February this year, U.S. imports from China is starting to trend upwards. Ideally U.S. imports from China must decrease and exports to China must increase in order to eliminate the traditional trade deficit with China. With the U.S. unemployment rate at 9.6% , rising credit card default rates, sluggish housing market and myriads of other economic issues, will the U.S. continue to be the biggest destination for Chinese exports?. Unlikely. I would bet that U.S. consumption of Chinese goods would decline triggering problems for Chinese exporters in the future. Hence China may have to look elsewhere to export its goods or grow its domestic markets in order to replace the diminished overseas demand.
