Tier 1 Capital Ratios and NPAs of Unofficial Problem Banks in the U.S.

We reviewed the Tier 1 Capital Ratios of large U.S. banks back in June. In this post, lets take a look at the Tier 1 Capital Ratios and Non-Performing Assets (NPAs) of some of the banks from the Unofficial Problem Banks list created by Calculated Risk. CR compiled this list from various press releases from the FDIC, OCC, Fed and OTC. In the table below, I have included banks that trade in the organized exchanges only. Banks that are in the process of merger are excluded.

The latest Tier 1 Capital Ratio and Non-Performing Assets (NPA) Ratio of Unofficial Problem Banks in the US are shown:

[TABLE=180]

Note: NA denotes “Not Applicable” if these ratios are not readily available. Data is known to be accurate at the time this article was written. Please do your own research before making any investment decisions.

Large US banks have Tier 1 Capital Ratios in excess of 10%. In the above list most of the banks have low Tier 1 ratio of under 10% which suggests they are weak and prone to fail. Most of the banks in the list are small banks with market capitalization of just a few millions. The stock prices of most these banks are are in the low single digits or even under a dollar.

Spokane,Washington-based AmericanWest Bank (AWBC) has the lowest Tier 1 Capital ratio at 3.3%. The bank has a market cap of just $9M at its current stock price of $0.54. Last week the the Fed ordered it to halt dividend payments and to submit a plan to improve its capital base. Banks that have Tier 1 capital ratios under 5% are First Mariner Bancorp (FMAR),First National Bancshares Inc (FNSC) and Horizon Financial Corp. (HRZB).

Banks with more than 10% Tier 1 ratio include ADVANTA Corp (ADVNA), Camco Financial Corporation (CAFI), Cadence Financial Corp (CACB), Capitol Bancorp Ltd.(CBC), City Bank (CTBK), Royal Bancshares of Pennsylvania Inc. (RBPAA) and United Community Financial Corp(UCFC).

City Bank (CTBK) has a nonperforming assets to total asset ratio of an incredible 47.38%. This is because City Bank was a lender focused on residential construction. Advanta Corp (ADVNA) which issues credit cards to small businesses and business professionals has been slapped with a notice by NASDAQ for failing to meet continued listing requirements. Current stock price is $0.59. With many small businesses going bankrupt and credit card charge defaults soaring, it is not surprising to see Advanta struggling to survive.

Due to their weak position many of the above 35 small banks will fail or be forced to merge with strong banks unless they raise additional capital and rid their balance of toxic assets. Unlike the “too big to fail” large banks, Uncle Sam will not bail out these small community banks.
Should You Avoid Investing in Danish, Irish and Spanish Banks Now?

Investors fled from Irish bank stocks during the credit crisis last year. The real estate bubble collapse in Ireland and the overall slump of the Irish economy added more losses for Irish banks. The third largest bank in Ireland, Anglo Irish Bank was nationalized back in January this year. Ireland saved the other two large banks – Bank of Ireland (IRE) and Allied Irish Banks, plc (AIB). 

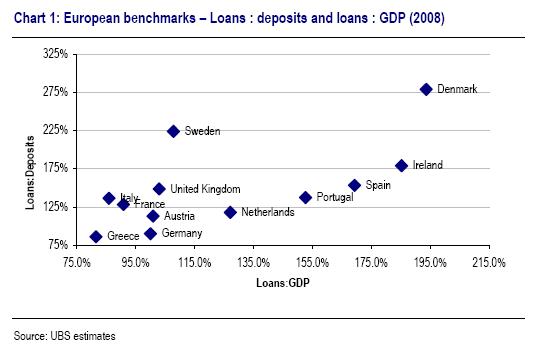
An article in ft.com/alphaville yesterday suggests that Ireland, Spain and Denmark may get into trouble because of their banks’ high loans to deposits ratio and loans to GDP ratio.

Euro-banks

In Something is rotten in the state of Denmark. And Ireland. And Spain, Tracy Alloway  quotes research by UBS analysts John-Paul Crutchley and Alastair Ryan on the European banking industry.

From the article:

“That is loans to deposits (y-axis) and loans to GDP (x-axis) by European country. A higher loan to deposit ratio implies the nation’s banking system is relatively over-lent — it has made available more credit to the private sector than can be sustained by the deposit base within the country. A high loan to GDP ratio suggests the economy is increasingly over-borrowed, or the private sector has borrowed excessively in relation to the country’s economic ability to sustain the debt. In short, you don’t really want to be in that upper right hand quadrant.

Here’s what the analysts say:

Countries and households can be over-borrowed and banking systems can be overlent. Both of these are found in the economies with the highest private-sector debt to GDP levels: Spain, Ireland and Denmark. These are also the economies we expect to deliver the weakest GDP out-turn over the next year. Ireland is already a significant creditor to the ECB and debt maturities mean Spain may follow suit, particularly if “round-tripping” to help fund government deficits continues.”

Spanish banks Banco Santander (STD) and BBVA (BBV) have significant overseas operations which must help with some of the losses from the domestic market. Danske Bank of Denmark trades on the OTC markets with ticker DNSKY. Danske reported losses for the second quarter last month and noted ” write-offs from bad loans could hamper profitability for the rest of the year.”

Will the U.S. Remain China’s Biggest Export Destination?

China is the second largest trade partner of the U.S.. Total trade with China amounted to $194B with the U.S. running a trade deficit (imports greater than exports) of $123B as of July this year. In fact, the U.S. has been running a trade deficit with China for many years now. In recent years however, the deficit gap has widened. As trade with China grew exponentially over the years, the trade deficit zoomed from just $6M in 1985 to $268B in 2008.

Last U.S. merchandise trade with China amounted to $405B. This represented about 12.4% of U.S. merchandise trade with the world.

US Exports to China in 2008 = $67.2 B

US Imports from China in 2008 = $338.0 B

This resulted in a merchandise trade deficit of $270.80 B with most of these goods ending up in US households.

In 2008, the top US exports to China were soybeans, computer chips, passenger airplanes, and copper and aluminum waste and scrap. The top imports from China were computers and their parts, wireless telephones, toys, and video games and their parts. In the services trade with China, the U.S. had a trade surplus of $6.2B.

China accounted for just 6% of the leading U.S. merchandise export markets in 2008 as the graph shows below:

US-Export-Markets

But US imports from China amounted to 16% of total imports. China alone accounted for 29.4% of the total merchandise deficit of $920B in 2008. The trade deficit was not large with our biggest trade partner Canada.

US-Imports

Source: THE YEAR IN TRADE 2008, U.S. International Trade Commission

On the services part of the U.S. trade, China accounted for just 3% of total U.S. exports in 2008 which is much lesser than the services trade with Mexico and Canada. Total U.S. exports to China as a whole has grown by more than 300% since 2000. The chart below shows the growth of U.S. exports till 2007:

US-Export-to-China-Growth

Source:
CHINA AND THE US ECONOMY:ADVANCING A WINNING TRADE AGENDA,
Recommendations for the New Administration and Congress, January 2009
The US-China Business Council

In 2008, the U.S. was China’s top destination for exports but the top three countries from where China imported goods and services were the Asian countries of Japan, South Korea and Taiwan. The U.S. was the fourth largest import supplier to China with a total value of $81.4B.

A few interesting points from the US-China Business Council Report and my views on them:

“The US economy dwarfs China’s. The United States added nearly two Chinas to its economy in the past decade. China is rapidly developing, but the United States has a much stronger foundation from which to build. In fact, the US and Chinese economies are greatly interdependent and need each other to succeed. ”

This is correct. Obviously the U.S. economy is a much larger economy than China’s. However the Chinese economy is growing faster than the U.S. economy. I do not believe that the US and Chinese economies are interdependent and need each other. They are inter-dependent now because it has been setup that way in the past few decades as US manufacturing shifted to take advantage of cheap labor and loose regulations in China. The Chinese economy needs the U.S. more than the US economy needs China’s. This is because before the 1980s the US economy did not depend much on trade with China and can easily grow without China. If the Chinese decide become a closed economy like in the past, the U.S. can import the goods it needs from other countries which would be more than willing to replace China as America’s largest trade partner. Mexico, Philippines, Vietnam, Brazil are some of the countries that would be happy to expand their manufacturing base to satisfy the American demand for cheap goods.

“US manufacturing faces an array of challenges, but China is not at the top of the list. The US share of global manufacturing output has been consistently above 20 percent since 1982. China is increasing its global manufacturing position, but it is primarily taking share from Japan and others in East Asia.”

The report argues that China simply took more manufacturing from other Asian countries such as Taiwan, Japan, South Korea, etc. It uses the example of Sony TV which used to be “Made in Japan” and sold in the U.S. Now the Sony TV would have the label “Made in China” since many Japanese manufacturers shifted production to China. While true, this examples does not answer the whole story. There are many more manufacturing sectors where U.S. based well-paying jobs disappeared in the last few decades. Besides the Japanse have always been a leader in consumer electronic goods.

“US services exports to China are growing and hold the potential to get even stronger. The United States has a services trade surplus with China, supporting high-quality, high-wage jobs in the financial, logistics, and legal sectors, to name a few.”

Growth in services export to China is highly unlikely to equal the growth in exports of goods or the imports of goods from China. While in the initial few years, the Chinese may depend on American services and technology such as nuclear technology for example, later on the Chinese will perform those services themselves and will not need the services of foreign companies. The report cites major US banks and financial institutions, law firms, business advisory, etc. as some examples of the services sector that has the potential to grow as the Chinese economy grows. It is true that these sectors have high- quality, high-paying jobs but they will not replace the millions of jobs lost in the manufacturing sector. A law firm, a consulting company or an investment firm will not need thousands of American workers to provide services in China. Besides some of these firms may establish branches in China and hire local labor to supplement a few American workers and provide services at a cheaper cost.

“Most of the answers are here at home. To succeed in the years ahead, we need smart policies on energy, healthcare, education, and innovation to maintain the competitive leadership of American companies and workers.”

The above point can easily be disproved. The Obama administration is investing heavily in green energy, health-care, education, etc. hoping that they would create millions of jobs and pull the U.S. economy out of this recession. This strategy will not work since these sectors will never produce well-paying, high-quality jobs that American workers need. Healthcare and education are highly regulated sectors and do not require millions of additional workers to cater to the needs of the current population. For example, there are already more universities and highly educated professionals than needed by the economy.

After hitting lows in February this year, U.S. imports from China is starting to trend upwards. Ideally U.S. imports from China must decrease and exports to China must increase in order to eliminate the traditional trade deficit with China. With the U.S. unemployment rate at 9.6% , rising credit card default rates, sluggish housing market and myriads of other economic issues, will the U.S. continue to be the biggest destination for Chinese exports?. Unlikely. I would bet that U.S. consumption of Chinese goods would decline triggering problems for Chinese exporters in the future. Hence China may have to look elsewhere to export its goods or grow its domestic markets in order to replace the diminished overseas demand.

Top Nine Canadian Energy Stocks

The S&P ADR Index, which tracks some of the large foreign companies traded in the U.S. markets, also includes many ordinary Canadian equities. The top nine energy companies of Canada are listed below. Energy trusts are excluded.

1.Cameco Corp. (CCJ)
Sector: Mining – Uranium
Earnings Growth (5 year): 10.21%

2.Canadian Natural Resources Ltd.(CNQ)
Sector: Integrated oil and gas
Earnings Growth (5 year): 13.85%

3.Enbridge Inc (ENB)
Sector: Oil Well Services & Equipment
Earnings Growth (5 year): 13.85%

4.EnCana Corp. (ECA)
Sector: Integrated oil and gas
Earnings Growth (5 year): 23.61%

5.Imperial Oil Ltd. (IMO)
Sector: Integrated oil and gas
Earnings Growth (5 year): 23.41%

6.Nexen Inc (NXY)
Sector: Integrated oil and gas
Earnings Growth (5 year): 28.21%

7.Suncor Energy Inc (SU)
Sector: Integrated oil and gas
Earnings Growth (5 year): 17.41%

8.Talisman Energy (TLM)
Sector: Integrated oil and gas
Earnings Growth (5 year): 33.99%

9. TransCanada Corporation (TRP)
Sector: Oil
Earnings Growth (5 year): 9.72%

Most of the companies noted above are in the oil and natural gas sector. This sector accounts for one of the large export revenue generators for Canada. Most of the oil and gas exports go to USA, its largest trading partner.The U.S. considers Canada to be an important and secure source of crude oil.

Most of the Canadian crude oil is extracted from the tar sands in Alberta. Calgary, Alberta-based Suncor Energy (SU) acquired Petro-Canada,another large integrated oil company in March this year. Petro-Canada operates gas stations under the same name. Imperial oil operates gas stations under the Esso brand.

Last month, the U.S. State Department granted approval for the construction of the US portion of the Enbridge (ENB) Alberta Clipper pipeline. The pipeline will carry crude oil to the U.S. midwest.The pipeline goes from Hardisty,Alberta to Superior,Wisconsin on the U.S. side costs about $3.7B to build. When completed it will transport 450,000 barrels per day with a maximum capacity of 800,000 per day if required.

Peru and Colombia – Top Emerging Economies in Latin America

A recent article in The Banker magazine praises Columbia and Peru for their economic growth. In the article On the Brink, author Jason Mitchell writes:

“While the Western world has been struggling through the global financial crisis, Latin America has shown a remarkable resilience to the upheaval. Two countries in particular – Colombia and Peru – are showing particularly impressive growth, and look set to become important emerging economies.

With the prudent macroeconomic policies pursued in Colombia and Peru over the past five years starting to bear fruit, the two countries are set to become much more important emerging markets in Latin America over the course of the next decade.“

Both Peru and Colombia are commodity-based economies. Colombia has oil, gold and copper while Peru is blessed with copper, gold and zinc. As the demand for these commodities grew exponentially worldwide in the past few years, these two economies soared. Between 2003 and 2008, the GDP grew at an average of 5.4% and 7% per year for Colombia and Peru respectively.

“According to the IMF, Peru’s GDP was $128bn last year (with a total population of 28 million people), while Colombia’s stood at $240bn (with 44.7 million inhabitants). The two countries have much smaller economies than Brazil and Mexico (at $1570bn and $1080bn, respectively), but are middle-ranking in size, comparable with Argentina and Chile (at $326bn
and $169bn, respectively).”

For US investors, 2 ADRs from Colombia and 2 from Peru are available for investment.

1. EcoPetrol (EC) is an integrated oil producer and distributor of Colombia with operations in Colombia and Northern Peru. EC stock is up about 54% YTD. The stock pays a 5.20% dividend yield. I wrote a post on EcoPetrol when it first listed its ADR on the NYSE last year.For more details go here.

2.BanColombia(CIB) is a full-service commercial bank offering a wide-range of services to its 6.4 million customers in Colombia.The current yield is 2.86%. CIB is up about 75% YTD.

3. Compania de Minas Buenaventura (BVN) is mining company with interests in silver, gold, zinc, lead and copper. The beta is 0.9. Average profit margin is about 51% and last year the company had total revenues of $762M.

4.The Peruvian financial services firm Creditcorp(BAP) is now domiciled in Bermuda. BAP has a dividend yield of 1.94%. The beta is 1.6. Average annual earnings growth in the past 5 years is 34% and the profit margin is about 19%.

Related ETFs:
GlobalX Funds’ Colombia ETF(GXG)

iShares MSCI All Peru Capped Index Fund (EPU)