Russia is one of the world’s major oil producers and exporters. Much of Europe including the economic engine Germany depend on Russian oil. Among the emerging markets China is a major consumer of Russian oil. The following infographic shows additional insights on the dependency of other countries for crude oil from Russia:
Click to enlarge
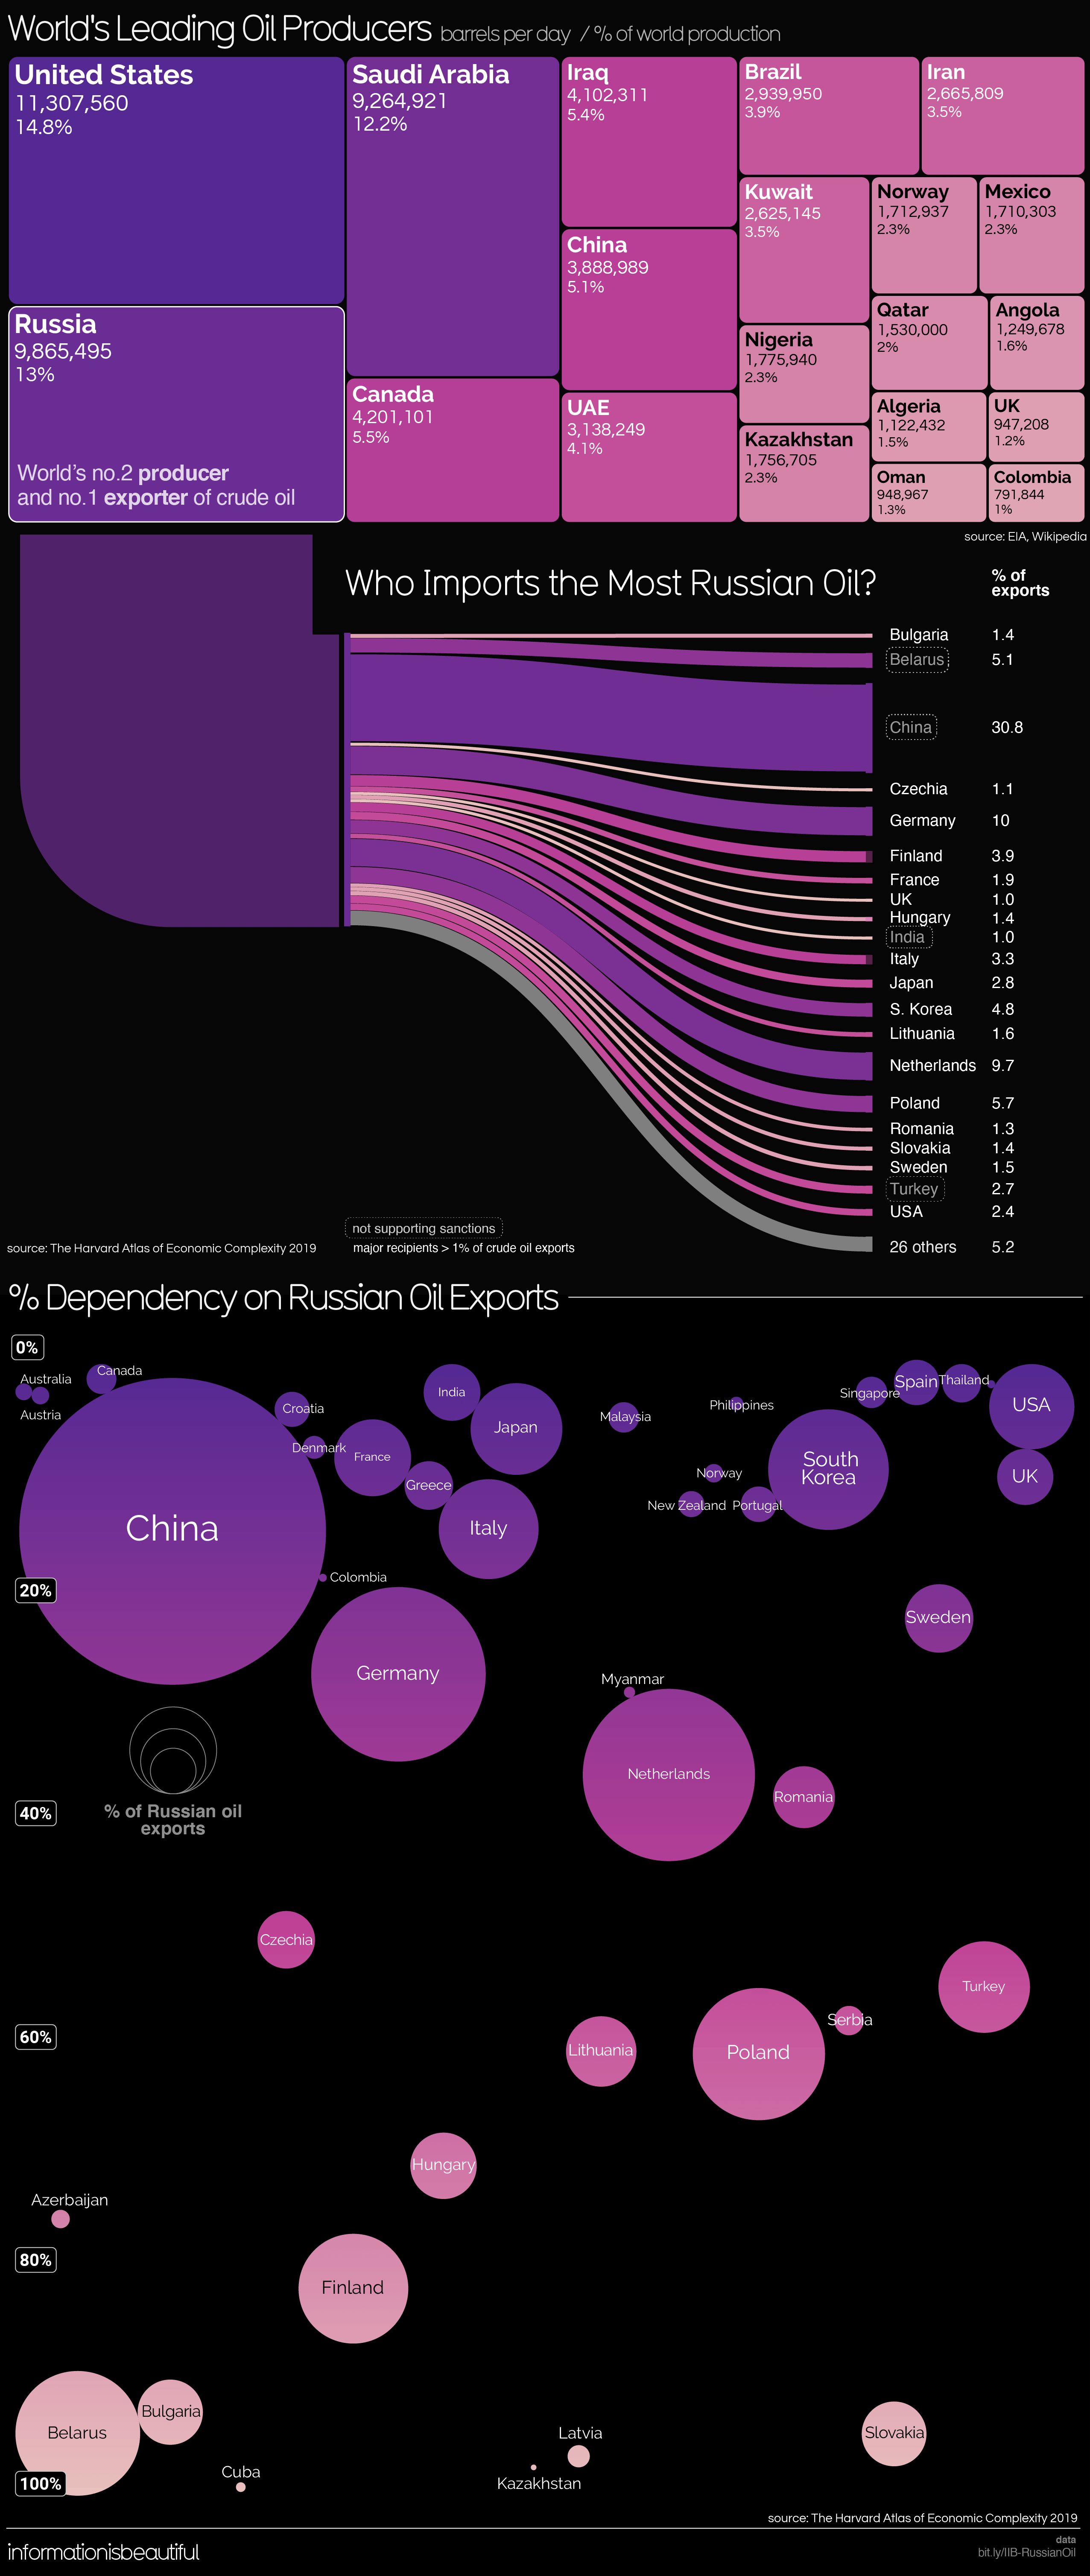
Source: Information is Beautiful