Consumer Staple Stocks May Provide Shelter

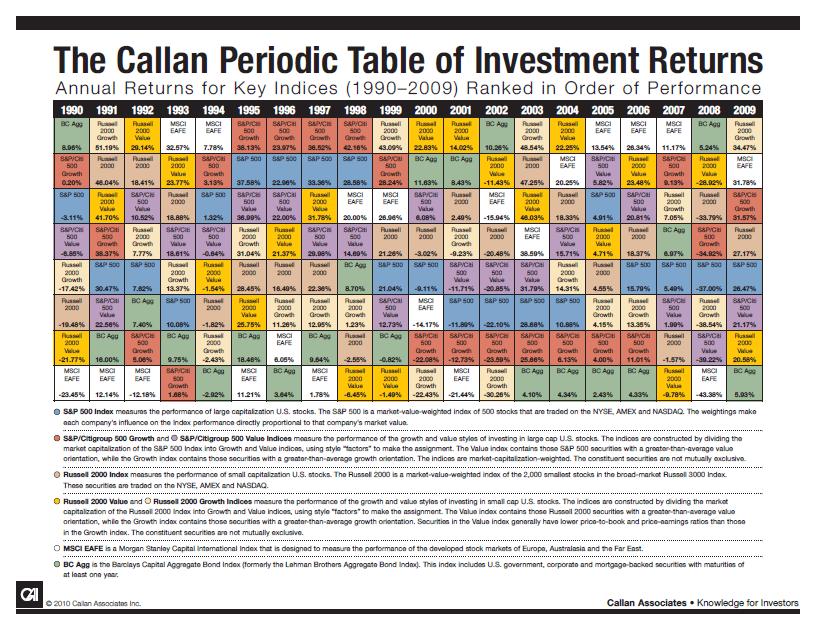
The S&P 500 is down 4.25% YTD. The consumer staples sector in the S&P 500 index is down only 2.11% YTD. In 2008 when the global credit crisis ravaged markets worldwide, consumer staples was the best performing sector with a decline of 16.61%. For example the financials were down about 50% that year.(Source: Periodic Table of Style Rotation — Why Diversification Matters, American Century Investments).

Generally consumer staple companies that make basic necessities of every day life such as dish washing liquids, soaps, toothpaste, etc. tend to offer stable growth and offer downside protection in adverse market conditions. People rarely cut down on consumer staples even when the economy is in recession. Items such as toothpaste, deodorant, soaps, etc. are cheap to afford. Companies in this sector make profits using economies of scale and product differentiation strategies. Investors looking for shelter in the coming storm this year may want to check out some of the stocks in this sector.

The table below lists 18 stocks in the Consumer Staple stocks traded on the NYSE:

[TABLE=386]

Some of the companies in the list have strong international presence. For example,Colgate-Palmolive (CL) makes a multitude of products such as Colgate Toothpaste, Palmolive dish-washing liquids, Irish Spring bath soaps, etc. Some of Colgate’s brands like Colgate toothpaste are highly popular in emerging countries. Colgate-Palmolive stock has been a long-term winner for investors. In the past 25 years (12/31/83 to 12/31/2009), the total return on a CL stock is a cool  4619% compared to 2989% for peer companies and just 1123% for the S&P 500.(Source: Colgate’s Investor Relations site). Similarly Cincinnati,OH -based Proctor & Gamble (PG) is a Fortune 500 company with operations in many countries. P&G is the owner of many global brands such as Gillette, Iams, Scope, Pampers, Bounty, Olay, etc.

Review: The Callan Periodic Table of Investment Returns 2009

Callan Associates has published The Callan Periodic Table of Investment Returns for 2009.

Chart
Click to Enlarge

Callan-Chart-2010

Some of the key observations from this chart include:

  • Global stocks rallied about 32% in 2009 while US S&P 500 climbed 26.5%
  • Small caps outperformed large caps for the ninth year out of the past 11 years
  • Fixed Income generated a 5.9% return

You can download the complete pdf version of “The Callan Periodic Table of Investment Returns (Key Indices: 1990-2009)” by clicking here

Related: The Callan Periodic Table of Investment Returns 2016: A Review

The Best and Worst Banks in the U.S.

Sixteen banks have failed so far this year. 1st American State Bank of Minnesota of Hancock, Minnesota was the latest bank to be shut down yesterday. In the past few years investing in bank stocks have gotten tricky as many of them have been battered by the credit crisis. However there are some high quality banks which continue to remain strong and pay dividends.

The Forbes magazine published a list of America’s best and worst 100 banks last month.

These banks were ranked on the following factors:

  • Return on average equity
  • Net interest margin
  • NPLs as a percentage of loans
  • NPAs as percentage of assets
  • Reserves as a percentage of NPLs
  • Two capital ratios (Tier 1 and risk-based)
  • Leverage ratio

The size of the banks selected ranged with assets of $5.2B to $2.3T. Investors can use the Forbes list as a starting point to identify potential candidates for investment opportunities.

The Five Best Banks are:

Bank of Hawaii(BOH)
Current Dividend Yield: 4.13%

UMB Financial (UMBF)
Current Dividend Yield: 1.97%

Commerce Bancshares (CBSH)
Current Dividend Yield: 2.45%

Prosperity Bancshares(PRSP)
Current Dividend Yield: 1.59%

SVB Financial(SIVB)
Current Dividend Yield:  N/A

The Five Worst Banks are:

Capitol Bancorp (CBC)
Sterling Financial (STSA)
R & G Financial
W Holding (WHI)
Flagstar Bancorp (FBC)

The highest ranked bank in this list was Bank of Hawaii(BOH). This conservative bank had a non-performing loan ratio of just 1.2% of total loans in the last quarter. Bank of Hawaii also declined TARP funds from the Federal government. Many of the banks that declined TARP funding actually increased lending.  Another bank that is noted in the article is Capital Bancorp (CBC) of Michigan.”The bank has a presence in 17 states, but has been badly hurt by the severe economic problems of its home state. Its capital ratios of 8.4% (Tier 1) and 11.2% (risk-based) are both sixth worst among the 100 largest banks. The bank is divesting businesses in six states, including problem areas like California and Ohio to boost its capital ratios and improve its balance sheet.”

The Top 50 U.S. Banks and Thrifts

Top 25 U.S. Bank Stocks To Consider

U.S. Public Healthcare Spending To Exceed Private Spending

The U.S. spends the highest amount for healthcare on a per-capita basis than other OECD member countries. Soaring health care costs continue to be a major concern for ordinary Americans.

In Public Health Tab to Hit Milestone, The Wall Street Journal notes that “For the first time, government programs next year will account for more than half of all U.S. health-care spending, federal actuaries predict, as the weak economy sends more people into Medicaid and slows growth of private insurance.”

Public spending accounted for 47% of the total health-care spending in 2008. Federal actuaries had predicted earlier that the government spending would cross the 50% mark by 2016. However they now predict that by 2012 public spending would exceed 50%.

Chart:

US-National-Health-Spending-2010

The main reasons for the rise in public health spending are:

  • The economic recession
  • Rising unemployment
  • Changing demographics
  • Baby-boomers retiring

The U.S. total heath care expenditures was estimated to reach $2.5T in 2009 accounting for 17.3% of GDP. Despite the decline in GDP health-care spending rose by 5.7% last year. Health-care spending is projected to increase to $4.5T in a decade.  As the number of unemployed people increases, they lose their private health-care benefits and some try to enroll into the Medicare and Medicaid. This is causing a rise in enrollments in those public programs.The Medicare program for poor people is projected to see a 5.6% rise in enrollments this year. Last year medicare expenses are estimated to have reached a whopping$507B.

Enrollments in private health-care plans is estimated to decline again this year due to the continued high unemployment levels and expiration of subsidies for the COBRA plan.

Sluggish growth in the job market, stagnant/declining wages in the private sector and rising health-care costs do not bode well for the future of U.S. economy.

Health Care Spending Comparison Across OECD Countries