Was TARP a Success to the US?

The Troubled Asset Recovery Program (TARP) was started by the U.S. government in 2008 to purchase assets and equity from troubled financial institutions and strengthen the sector at the height of the credit crisis. Billions of tax payer funds were loaned to banks and other lenders thru this program.

According to a report in The Banker magazine, it seems that the TARP was successful to the US in terms of return on investment and the stated goal of the program. The following are some of the key points quoted by the magazine based on the July report from SIGTARP, the body monitoring the various programs under the umbrella of the TARP:

  • 87 TARP recipients had repaid all or a portion of their principal or repurchased shares, for a total of $201.5B.
  • A total of just $182.5B of disbursed TARP funds is outstanding.
  • By July, the US government had received $22.7B in interest, dividends, sale of warrants, stocks and other income.
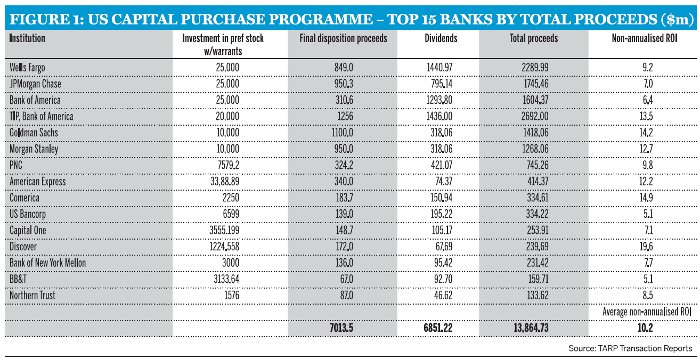
Click to Enlarge

figure1_us-capital-purchase-programme.jpg

Source: The Banker

  • Of the 707 banks that received almost $205B in TARP funds through the Capital Purchase Program (CPP), 76 have fully repaid their funds to a total of $138.4B. Hence the US has recovered 67.5% of the funds invested in banks.
  • Of the remaining banks that owe money to the US, 580 of them owe less than $100M.
  • The US government reaped a high rate of return on the TARP funds that have been fully repaid already.The top 15 by total proceeds yielded an average non-annualized return of 10.2%.
  • Some examples of individual returns include Discover Financial Services(DFS), Comerica(CMA) and Goldman Sachs(GS) with 19.6%, 14.9% and 14.2% on an non-annualized return basis respectively.
  • In addition to TARP funds, Bank of America(BAC) and Citigroup(C) each received an additional $20B thru the Targeted Investment Program(TIP). Including this loan, the  interim, non-annualized return on investment based on the amount repaid by Citigroup so far is 15.91%.

When the TARP program was implemented there was much outcry from the general public. However the data above shows that the program not only achieved its stated objective but also yielded an excellent return to the US government.

Related:

As TARP Fades, a Look at Its Flaws and Its Success

TARP Didn’t Bust the Bank

The Best Asian Banks by Country 2010

This week FinanceAsia announced the winning banks for many Asian countries for 2010. These banks were selected based on many factors. From the news report:

“The selection of the winning bank is a highly quantitative one, with each bank scored on a number of key performance metrics. Public Bank scored the highest of the 11 shortlisted banks.

The Best Asian Bank award is given to the bank that ranks the highest among the 11 banks that have individually won our Best Bank award for each country. We ranked the banks by a series of metrics and also by their scores in Standard & Poor’s Bank Fundamental Strength Ratings. The metrics used include: return on assets, return on equity, profit per employee, total assets, percentage of net income derived from fee business, gross NPL ratio, the compound annual growth rate, price-to-book ratio and net interest margin.

The best-ranked bank for each metric got 11 points and the lowest-ranked got 1 point.”

The selection process short-listed 11 banks. The country winners for this year are listed below:

  1. China Construction Bank (China)
  2. HDFC Bank (India)
  3. Bank Mandiri (Indonesia)
  4. Public Bank (Malaysia)
  5. Banco de oro Unibank (Philippines)
  6. DBS (Singapore)
  7. Shinhan Bank (South Korea)
  8. Commercial Bank of Ceylon (Sri Lanka)
  9. Chinatrust Commercial Bank (Taiwan)
  10. Kasikornbank (Thailand)
  11. Asia Commercial Bank (Vietnam)

HSBC(HBC) won the Best Bank award for Hong Kong but was excluded as it is really a global bank.

Public Bank of Malaysia won the award for the Best Asian Bank for this year. From the bank’s website:
“Public Bank is a top-tier bank in Malaysia, well-reputed for its prudent management, superior customer service, uncompromising service delivery standards and strong corporate governance and corporate culture. Public Bank remains untouched by the global financial crisis which wrecked havoc in major financial centres around the world.

Public Bank has paid a dividend every year since 1970.

China Construction Bank (OTC: CICHY) is one of China’s “big four” banks. Currently it pays a 3.52% dividend. HDFC Bank(HDB) is one of the largest private sector banks in India.Among the BRIC countries, Indian stocks have become expensive after a strong run up in recent months.HDB’s P/E ratio is over 41 and the stock yields a tiny 0.45% dividend at current levels. Public Bank(OTC: PBLOF) has a 4.49% yield.

Five Chinese Bank ADRs

The following are five Chinese bank stocks trade in the US unsponsored ADRs. The stock price noted is as of market close September 1, 2010.

1.Bank of China (BACHY)
Current Share Price: $12,69

2.China Construction Bank Corporation (CICHY)
Current Share Price: $42.11

3.China Merchants Bank (CIHKY)
Current Share Price: $12.93

4.China Minsheng Banking (CMAKY)
Current Share Price: $9.11

5.Industrial and Commercial Bank of China (IDCBY)
Current Share Price: $36.90

Savings Rate, Household Debt: U.S. vs. Canada

Canada avoided much of the impact of the global financial crisis especially with regards to its financial system. Canadian banks and regulators alike won praise from investors worldwide for following prudent,conservative policies with respect to risk management. While for many quarters the big five Canadian banks met or exceeded expectations, recently however Bank of Montreal and Royal Bank reported disappointing earnings for the second quarter.

Savings Rate:

In the past, Americans used to save less than Canadians. But the phenomenon is changing. Nowadays due to de-leveraging the personal savings rate in the U.S. is higher than Canada as shown in the chart below:

Click to Enlarge

Saving-Rate-US-Canada

Source:  The Boeckh Investment

From the latest edition of The Boeckh Investment report:

“While Canada has deservedly had a good ride in recent years particularly through the global recession, due to strong Federal Government finances and a strong balance sheet, all is not quite as rosy as meets the eye. Chart 16 shows that, while the U.S. savings rate has gone from 2% to 6.5% since 2007, the Canadian savings rate, after a brief rally, has collapsed to about 2 1/2%. Canadian households have continued to add to their debt, oblivious to the changed world environment. House prices rose to new highs during the recovery, while U.S. house prices are down over 30% from their peak. Moreover, while federal debt levels and trends are good by world standards, provincial debts are disastrous. There is even some talk of Ontario going the way of California. Its per capita public debt is ten times that of California whose bonds are rated slightly less risky than Croatia’s.”

Household Debt:

Canadian household debt continued to increase in 2008 and 2009 while in the U.S. it decreased as shown in the table below:

US-Canada-Household-debt

Source: Where is the Money Now: The State of Canadian Household Debt as Conditions for Economic Recovery Emerge, The Certified General Accountants Association (CGA) of Canada

From the CGA study:

“A cross-country comparison of household debt in Canada and in the US may be a useful exercise for a number of reasons. Both countries have relatively high levels of per capita income and living standards, are located in geographical proximity to one another, and share close historical and commercial ties. Both countries have experienced similar rates of inflation in the past decade and exhibit great resemblance in demographic characteristics when it comes to aging population, levels of labour force participation, and high reliance on immigration.

Similar to the situation in Canada, US households have been rapidly increasing their indebtedness in the past two decades with total household debt outgrowing consumer spending and disposable income. However, during the most recent recessionary period, some noticeable differences emerged in the debt dynamic of Canada and the US. Specifically, in Canada, mortgages and particularly consumer credit continued to expand in 2008 and 2009 at annual rates very similar to those seen prior to the economic downturn. In contrast, the US saw brisk contraction in both components of household debt (Table 2). In turn, a dramatic drop in interest rates that occurred in both Canada and the US at the end of 2008 did not much alter the household debt-service burden in either country, leaving it at approximately the same level in 2009 as it stood in 2006.”

It must be noted however that difference in the debt-service ratios between U.S. and Canada is large because of the methodology used to calculate the figures. In the U.S. mortgage interest paid is tax deductible but it is not allowed in Canada. This creates an incentive for borrowing in the U.S.

Overall while on the surface Canada appears to be much stronger than the U.S., in reality it is not based on some factors.  Unlike the U.S., Canada is still a commodity-based economy and is heavily dependent on trade with the US. Should the housing market in Canada collapse and the US economy enter another recession, the Canadian economic strength will be tested significantly.