The 10 most profitable publicly-listed Spanish companies that appear in the Forbes Global 2000 list for 2010 are listed below:
[TABLE=578]
Related ETF:
iShares MSCI Spain Index (EWP)
The 10 most profitable publicly-listed Spanish companies that appear in the Forbes Global 2000 list for 2010 are listed below:
[TABLE=578]
Related ETF:
iShares MSCI Spain Index (EWP)
The 10 largest publicly-listed Malaysian companies based on sales for 2009 that appear in the Forbes Global 2000 list for 2010 are listed below:
[TABLE=565]
Related ETF:
iShares MSCI Malaysia Index Fund (EWM)
Credit-card debt in the U.S. recorded the twenty-fourth straight monthly decline in August according to the Federal Reserve. Revolving credit-card debt fell $5.0 billion 0r 7.2% in August. As US consumers continue the process of balance-sheet de-leveraging, the outstanding credit-debt will decline further.
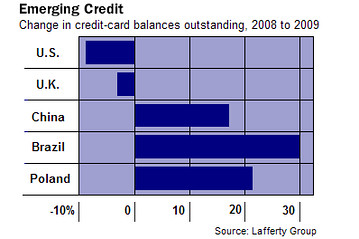
However while the outstanding credit-card debt is declining in the U.S, it is surging in emerging markets such as Brazil and China. From a Wall Street Journal article :
“While consumers throughout the developed world struggle to shed debt, their counterparts in China and Brazil are piling it on.
In 2009, the year the global recession hit bottom, the aggregate credit-card balances of Chinese consumers rose 17.1% even as those of U.S. consumers fell 8.7%, according to a study by financial consultancy Lafferty Group. Brazilians increased their balances by 28.9%, part of a 9.2% rise throughout Latin America.”
The article further noted that “As of 2009, China, Brazil, India and Russia had a total combined credit-card balance of $143 billion, still a far cry from the U.S.’s $849 billion but getting into the same league.”
The five fast-growing credit-card issuers in the world are China’s ICBC, China Merchants Bank and Brazil’s Itau Unibanco(ITUB), Banco Bradesco(BBD) and Banco do Brasil(BDORY). The highest ranking issuer among the top five is ICBC of China which has 54 million cards in circulation. On the other hand, the number of cards issued by some of the top banks in the developed world such as HSBC(HBC), Bank of America (BAC) and JPMorgan Chase (JPM) fell drastically last year. Bank of America saw a decline of 29% to 54 million cards.
Among the European economies Germany has recovered strongly since the credit crisis ended. Much of the credit for this success can be attributed to the excellent policies implemented by the German government despite facing many pressures such as the bailout of Greece. The labor market continues to show improvement with the unemployment rate falling to 7.2% in September from 7.6% in October.
German exports have also rebounded sharply. From a report by the Federal Statistics Office:
“Germany exported commodities to the value of Euro 75.1Â billion and imported commodities to the value of Euro 66.1Â billion in August 2010. Hence, German exports increased by 26.8% and imports by 29.2% in August 2010 on August 2009.
The foreign trade balance showed a surplus of Euro 9.0 billion in August 2010. In August 2009, the surplus amounted to Euro +8.1 billion.”
 Many other factors such as leadership positions in sectors such as chemicals, engineering, renewable energy, etc, innovation, conservative business management style, etc. favor investment in Germany. Hence investors looking to gain some exposure to German equities can consider the following five stocks. All these stocks currently have dividend yields of more than 5%.
Photo: Hannover, Germany
1. E.ON AG (OTC: EONGY)
E.ON is one of the largest German electric and natural gas utilities with operations in central Europe, the U.K., Nordic countries and the U.S. From a high of over $70 in early 2008, the share price has fallen heavily to close at $29.59 on Friday. At the current level, the stock has an attractive yield of 6.41%.
2. RWE AG (OTC:RWEOY)
RWE AG is another German electric, gas and water utility giant with presence in The Netherlands, Belgium, United Kingdom, Central and Eastern Europe. Based on Friday’s closing share price of $67.93 the dividend yield is 6.85%. For this year and 2011 the company has planned a dividend payout ratio of 50-60%. Long-term investors in RWE have been rewarded well. For example, a 10,000€ investment made on 1/1/2000 in the common stock traded on the domestic market is worth €19,205.14 today with dividends reinvested. This amounts to an annualized total return of 6.25%.
3. Muenchener Rueckversicherungs Gesellschaft AG (OTC:MURGY)
Munich RE is an international reinsurance company.Reinsurance companies offer insurance for insurance companies. Munich RE Group’s gross written premium last year was €41.4 billion. For the first half of this year the company posted a profit of €1.2 billion. The stock currently has a 5.26% dividend yield.
4. Hannover Rueckversicherung AG (OTC:HVRRY)
Like Munich RE, Hannover Re is also a German reinsurer with gross written premium of about €10.0 billion. Hannover RE transacts with over 5,000 insurance companies in about 150 countries around the world. The OTC-traded ADR pays a dividend of 5.56%.
5. Deutsche Telekom (OTC:DTEGY)
Deutsche Telekom is a telecom services provider with operations in Germany, the United States, Europe, Southern and Eastern Europe. In the U.S. the company operates the mobile phone service under the T-Mobile brand. Based on Friday’s closing share price of $13.73, the dividend yield is 7.51%.
The 10 largest publicly-listed Singapore companies based on sales for 2009 that appear in the Forbes Global 2000 list for 2010 are listed below:
[TABLE=577]
Related ETF:
iShares MSCI Singapore Index Fund (EWS)