Emerging Markets:Soaring Auto Sales Should Benefit Infrastructure Companies

The huge rise in the middle-class population in emerging countries such as India, China, Brazil, etc. is leading to strong growth in automobile sales. For example, 13.6 million cars, trucks and other vehicles were sold in China in 2009 making it the largest auto market in the world ahead of the U.S.  This figure represents a 46% increase from the previous year. Compared to China, just 10.4 million vehicles were in 2009 in the U.S. At the beginning of this year, four million private cars clogged the streets of Beijing.In the first 11 months of 2010, automakers in China shipped a total of 16.4 million vehicles to dealers representing a 34% increase from 2009, according to China Association of Automobile Manufacturers (CAAM).

Similar to China, Brazil overtook Germany to become the fourth biggest car market in the world. By the end of 2010,  a total of 3.45 million vehicles are forecast to have been sold in Brazil. This is about 10% higher than 2009. With a population of 192 million Brazil has a low vehicle density of just one vehicle per seven residents compared to much higher levels in the developed world. The top three car companies in Brazil are Fiat (FIATY), Volkswagen(VLKAY) and General Motors (GM).

The chart below shows the vehicle density in select countries:

Global-Comparison-Vehicle-Density

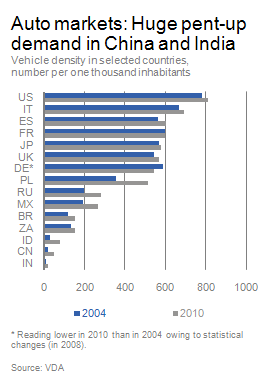
Source: Deutsche Bank Research

The U.S. ranks first in the world with over 800 vehicles per 1,000 inhabitants followed by western European countries and Japan. With developed countries having about two-thirds of the total global vehicle stock, the car market in those countries is becoming saturated.

From the Deutsche Bank Research report:

China and India are at the lower end of the list of large economies in terms of vehicle density. In the US, for instance, the ratio of cars to inhabitants is fifty times higher at present than in India. Nonetheless, the emerging markets are catching up quickly. The number of vehicles per capita in India, for instance, rose by more than 60% between 2004 and 2010, while China registered an increase in excess of 150% in the same period. The world’s two most populous nations are very likely to see vehicle density double during the current decade. In absolute terms this would mean an increase in the combined stock of motor vehicles in China and India of more than 135 million units. This would correspond roughly to the current joint vehicle stock of Germany, France, Italy, the Netherlands and Belgium.

The explosive growth in auto sales in emerging markets should immensely benefit companies in the infrastructure space in these countries. Hence in order to profit from the growth of auto markets  investors may be better off gaining exposure to companies engaged in building transportation infrastructure than investing in auto makers. This is because the auto industry is has a low return on equity and shareholders of many auto companies have not enjoyed high returns. In fact companies such as the American auto giant General Motors went bankrupt and is now recovering after a huge government bailout.

Related ETFs:
EGShares India Infrastructure ETF (INXX)
EGShares Brazil Infrastructure ETF (BRXX)
EGShares China Infrastructure Index Fund (CHXX)
iShares S&P Emerging Markets Infrastructure Index Fund (EMIF)
PowerShares Emerging Markets Infrastructure Portfolio (PXR)

Disclosure: No Positions

Stocks Beat Commodities In the Long Run

In recent years ordinary investors have been attracted to all types of commodities such as gold, silver, oil, natural gas, etc. primarily due to the poor performance of equities and also the availability of easy avenues to invest in them such as ETFs. Despite all the glamor of investing in commodities, equities are still the best long-term investments. The chart below compares the performance of real commodities and other asset classes since 1897:

Click to enlarge

realcommodityprices-socgen1.jpg

Source: Via FT Alphaville Blog

Clearly the S&P 500 has had a much higher growth than bonds, T-bills and commodities in the time period shown. Real commodity prices on the other hand have gone nowhere.Unlike stocks, commodities are extremely volatile and are not suited for all investors.Though the time period shown in the chart is over a century, commodities are still not the best investment option even in shorter durations as confirmed by the rise and fall in the commodity prices with the overall trend pretty much flat.

Related ETFs:

SPDR Gold Trust ETF (GLD)
iShares Silver Trust ETF (SLV)
United States Natural Gas Fund (UNG)
United States Oil Fund (USO)
SPDR S&P 500 ETF (SPY)

Disclosure: No Positions

Employment Growth Lags GDP Revival In Recoveries

The Great Recession that started in December 2007 ended in June 2009, according to The National Bureau of Economic Research. While the recovery from June last year has been modest, the unemployment rate has worsened since then and now continues to hover around the 10% mark. According to official figures, in November the U.S. unemployment rate stood at 9.8% with 15.1 million people unemployed.

With millions of Americans looking for work, competition is tough for all types of jobs and companies are brutally cutting down wages by hiring temporary workers to raise profits. The phenomenon of thousands of people competing for a handful of available positions is  usually seen in third-world countries. However that is now becoming increasingly common here in the United States. For example, a recent Bloomberg article noted that 420 Flight-Attendant jobs with U.S. Airways drew 4,000 applicants.Similarly in October, Delta Air Lines received 100,000 applications for 1,000 such jobs. Despite U.S. companies sitting on record amounts of cash on their balance sheets and corporate profits increasing strongly, job growth is not occurring at a faster pace.

An article in The New York Times discusses the growth of temporary workers in the U.S. workforce. From the article:

To the more than 15 million people who are still out of work, those with temporary jobs are lucky. With concerns mounting that the long-term unemployed are becoming increasingly unemployable, those in temporary jobs are at least maintaining ties to the working world.

The competition for them can often be as fierce as for permanent openings, and there are still far too few of them to go around. Indeed, the relative strength in temporary hiring has done little to dent the stubbornly high unemployment rate, which rose to 9.8 percent in November.

“With business confidence, particularly in the small business sector, extremely low,” said Ian Shepherdson, chief United States economist at the High Frequency Economics research firm, “it’s not surprising that permanent hiring is lagging behind.”

The landscape two or three years from now might look quite different, of course. Many economists and executives at temporary agencies say there are signs that more robust permanent hiring is coming in the new year. Business confidence is up, and temporary agencies report that the percentage of interim workers who have been offered full-time jobs is also up from last year.

Nevertheless, there are signs that this time around, the economy could be moving toward a higher reliance on temporary workers over the long term.

This year, 26.2 percent of all jobs added by private sector employers were temporary positions. In the comparable period after the recession of the early 1990s, only 10.9 percent of the private sector jobs added were temporary, and after the downturn earlier this decade, just 7.1 percent were temporary.

Temporary employees still make up a small fraction of total employees, but that segment has been rising steeply over the past year. “It hints at a structural change,” said Allen L. Sinai, chief global economist at the consulting firm Decision Economics. Temp workers “are becoming an ever more important part of what is going on,” he said.

Contrary to the convention wisdom that job growth should lead recoveries, employment growth in general actually lags GDP growth. The following chart shows that in the past recessions, employment has taken many quarters to recover than GDP growth:

GDP-Job-Growth-Relationship

So based on past evidences,U.S. unemployment rate will slowly decline over the coming quarters.

An indicator of economic distress is the Misery Index. It is sum of inflation and unemployment. This index gained popularity during the presidential election of 1980. The chart below shows the Misery Index for advanced economies:

Misery-Index

Source: Finance & Development, December 2010, IMF

Since 1980, the index has declined in the U.S. and other developed countries mostly due to the taming of inflation. Unemployment however has remained a problem and continues to be so. In fact, during the Great Recession the contribution of unemployment to the Misery Index has increased sharply.

Top 25 Hot Tech Growth Companies 2010

Bloomberg BusinessWeek has published the list of 50 Tech Hot Growth Companies 2010. This ranking is based on various factors such as sales growth, return on invested capital, and the change in number of employees.

This year’s list confirms that China is officially a technology powerhouse with two of the five top companies represented by Chinese firms.Tencent Holdings (TCEHY) took the number one spot and Baidu (BIDU) took the third place. U.S. Technology giant Apple(AAPL) took the second place. This is the first time that a Chinese company has taken the number 1 and number 3 ranks.

In terms of representation, U.S.companies dominate the list as usual. In addition, based on market capitalization as of October 15th, 2010 U.S. firms Apple (AAPL), Oracle (ORCL) and Cisco (CSCO) take the top 3 ranks. Wipro (WIT) and Infosys Technoliogies (INFY) are among the four Indian outsources that made it to this list.

The Top 25  Tech Hot Growth Companies 2010 are listed below:

[TABLE=856]

The full list of 50 companies can be found here.

Two-Track Recovery: Emerging Markets vs.Developed Markets

The divergence between the economic growth of emerging markets and development markets  is projected to continue next year. As in the recent few years, economic growth in emerging economies is estimated to outpace growth in developed economies.

The graph below shows the Real GDP Growth for Emerging Asia and Latin America relative to developed markets:

Click to enlarge

gdp-em-dev-growth.png

Source: Bulletin, The Credit Suisse Magazine

The following chart shows the real GDP, growth for various economies and their contribution to the World GDP:

gdp-growth.png

Source: Bulletin, The Credit Suisse Magazine

In 2009, the U.S. accounted for just about one-fifth of the world GDP.Credit Suisse estimates that growth from the developed world would account for less than one-third of the global growth in 2011.Based on this logic, emerging markets are a better bet for investment than developed markets. However this assumes that strong economic growth leads to higher investment returns.

Related ETFs:

iShares MSCI Emerging Markets Index (EEM)
Vanguard Emerging Markets ETF (VWO)
SPDR S&P 500 ETF (SPY)
SPDR STOXX Europe 50 ETF (FEU)

Disclosure: No positions