The top three oil producers in 2021 were the USA, Saudi Arabia and Russia. The US was not only the largest producer but was also the largest consumer in the world.
Click to enlarge
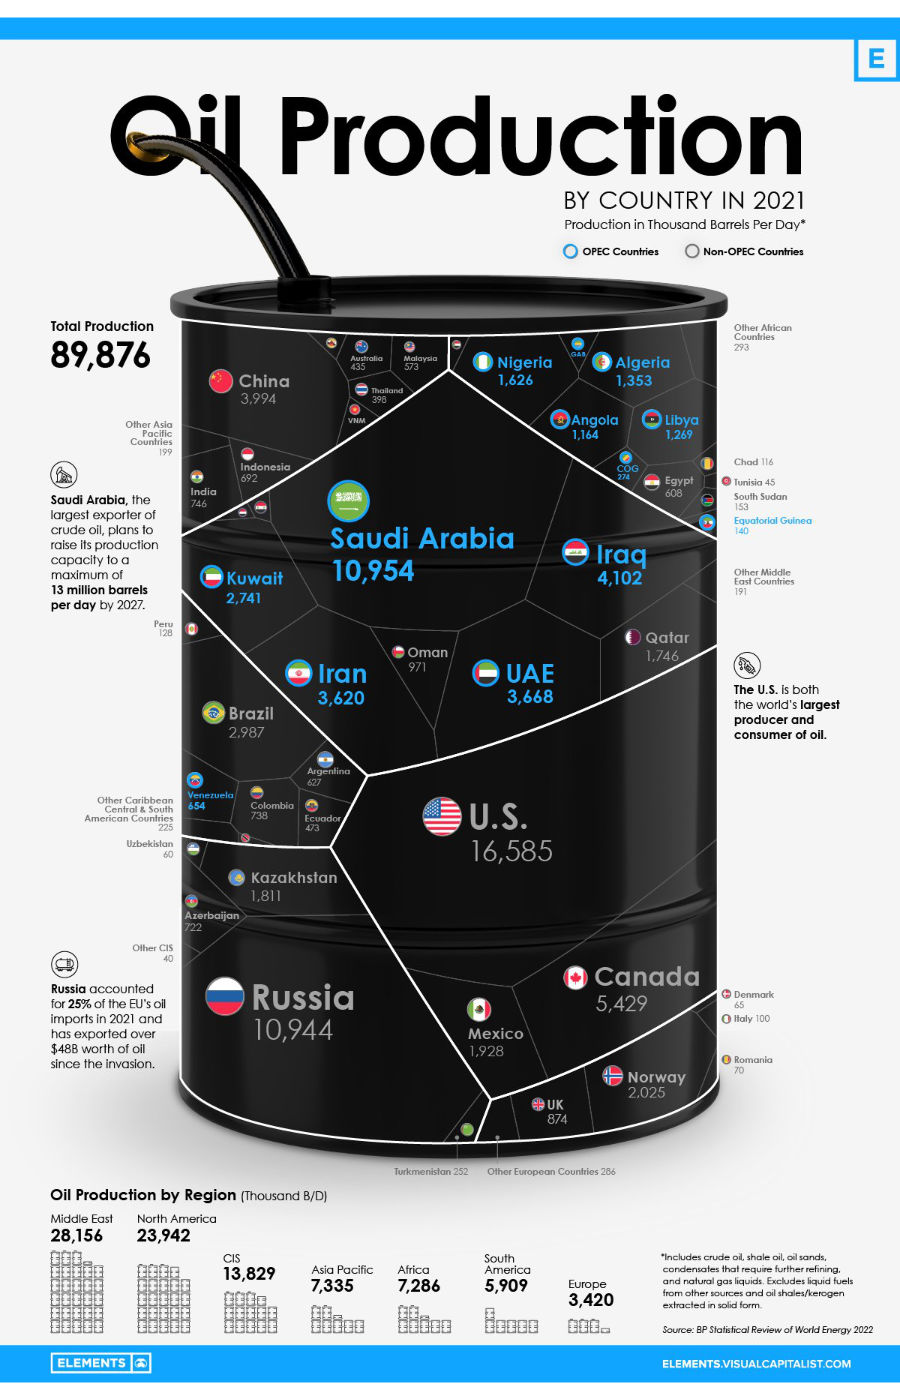
Source: Visual Capitalist via Market Index
The top three oil producers in 2021 were the USA, Saudi Arabia and Russia. The US was not only the largest producer but was also the largest consumer in the world.
Click to enlarge
Source: Visual Capitalist via Market Index
Below is a neat infographic on how mining helps us build a better world. From copper to nickel to rare earth metals to lithium it is impossible to underestimate the importance of these metals.
Click to enlarge
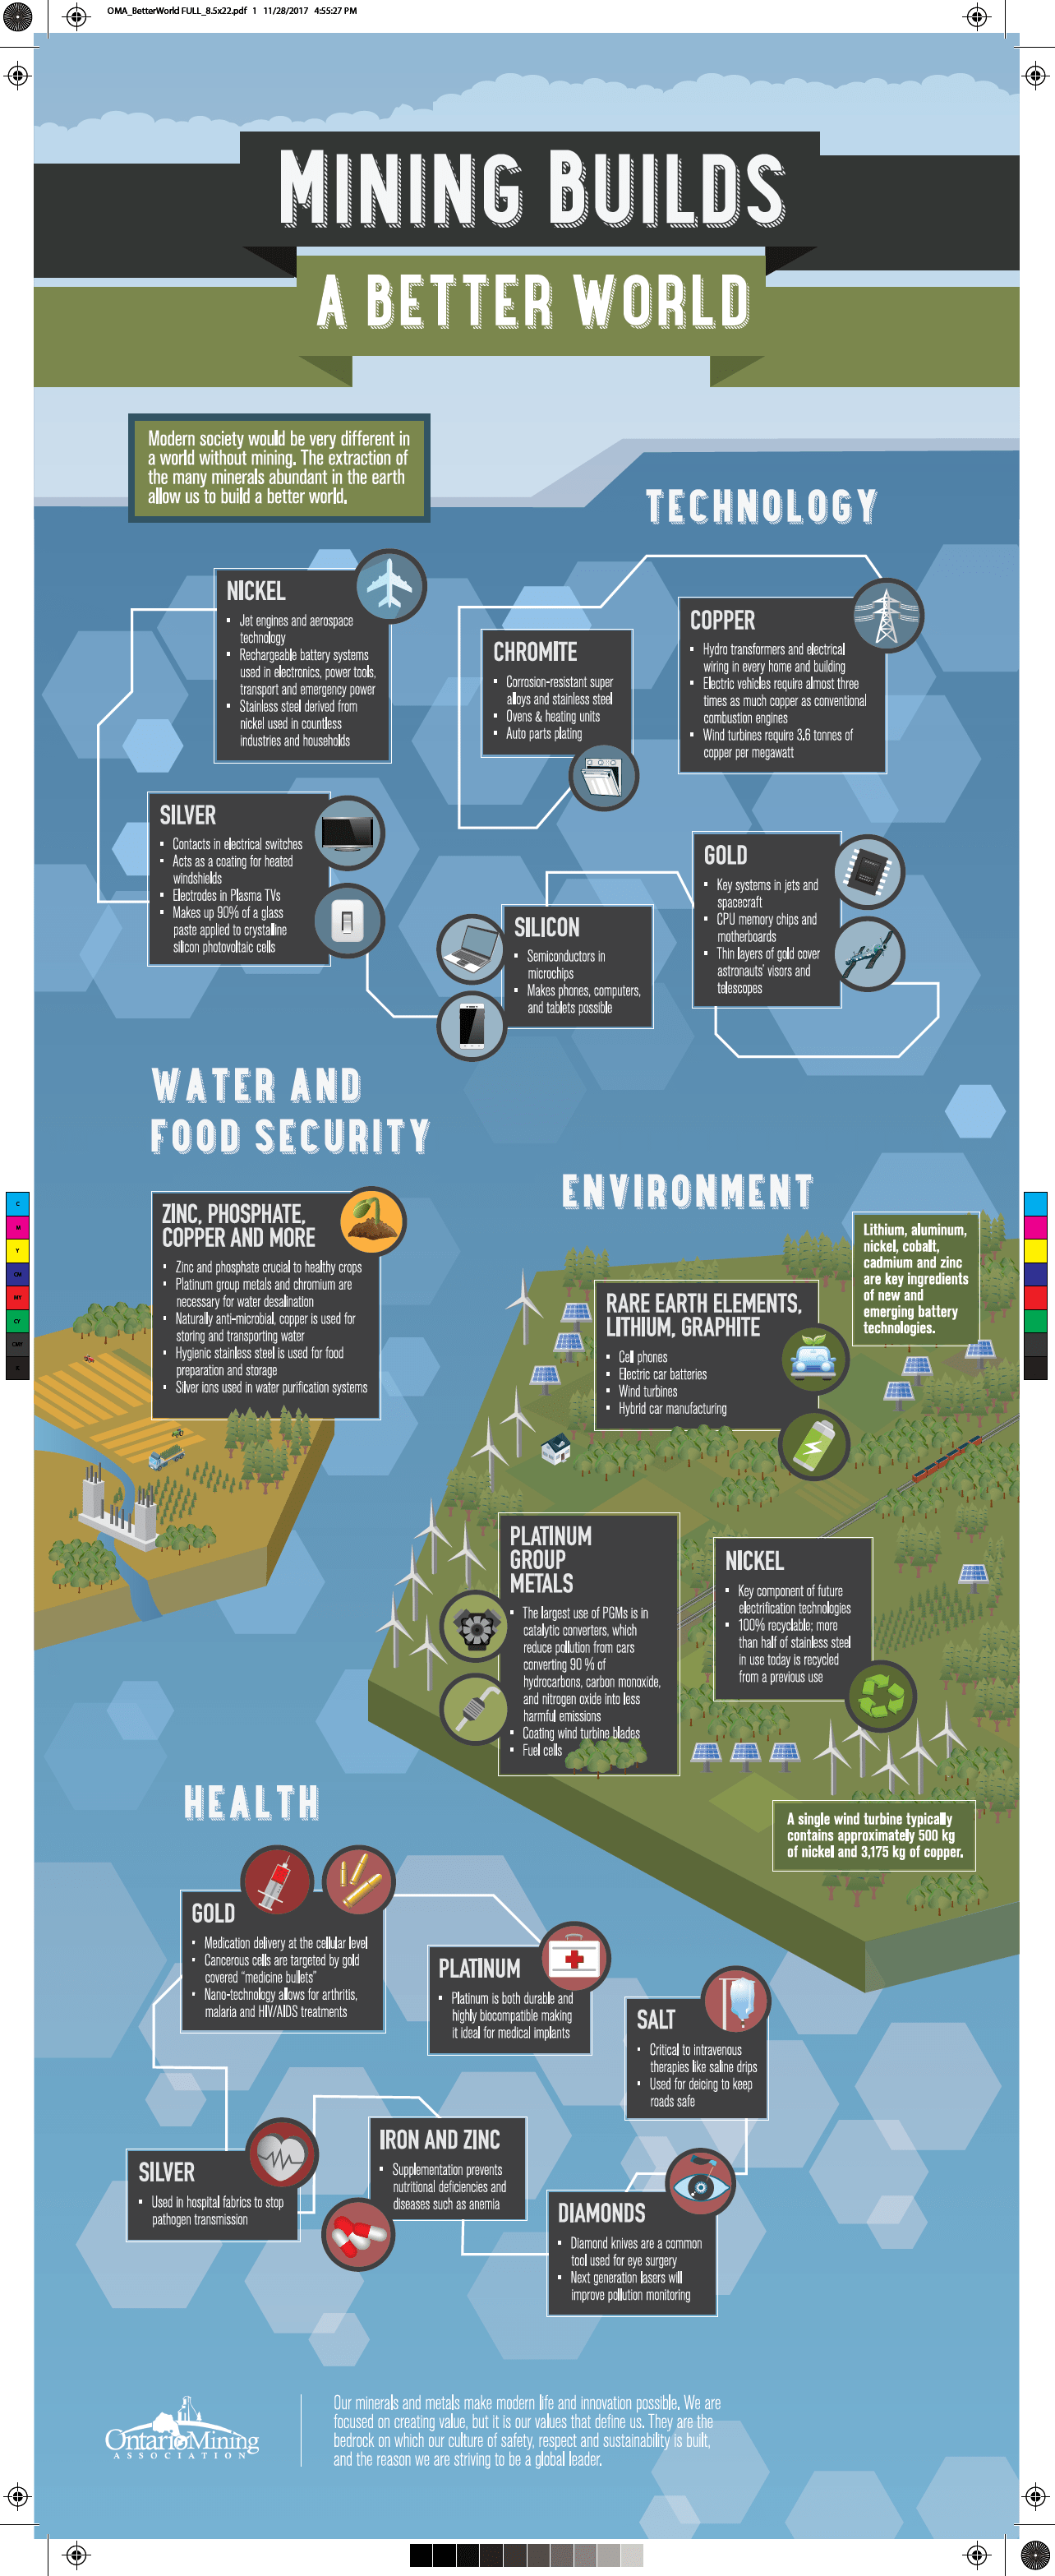
Source: The Ontario Mining Association
The saga with Russian DR programs continues to evolve. I posted a note on Automatic and Forced Cancellation as notified by the depository BNY Mellon on mid-last month. Today BNY Mellon has published the below important update on the automatic conversion of Russian ADRs. As the deadline nears for the cancellation of these ADRs, many investors who still haven’t take action have questions on what would would happen to their holdings. So its important to monitor these developments and take appropriate actions.
Click to enlarge
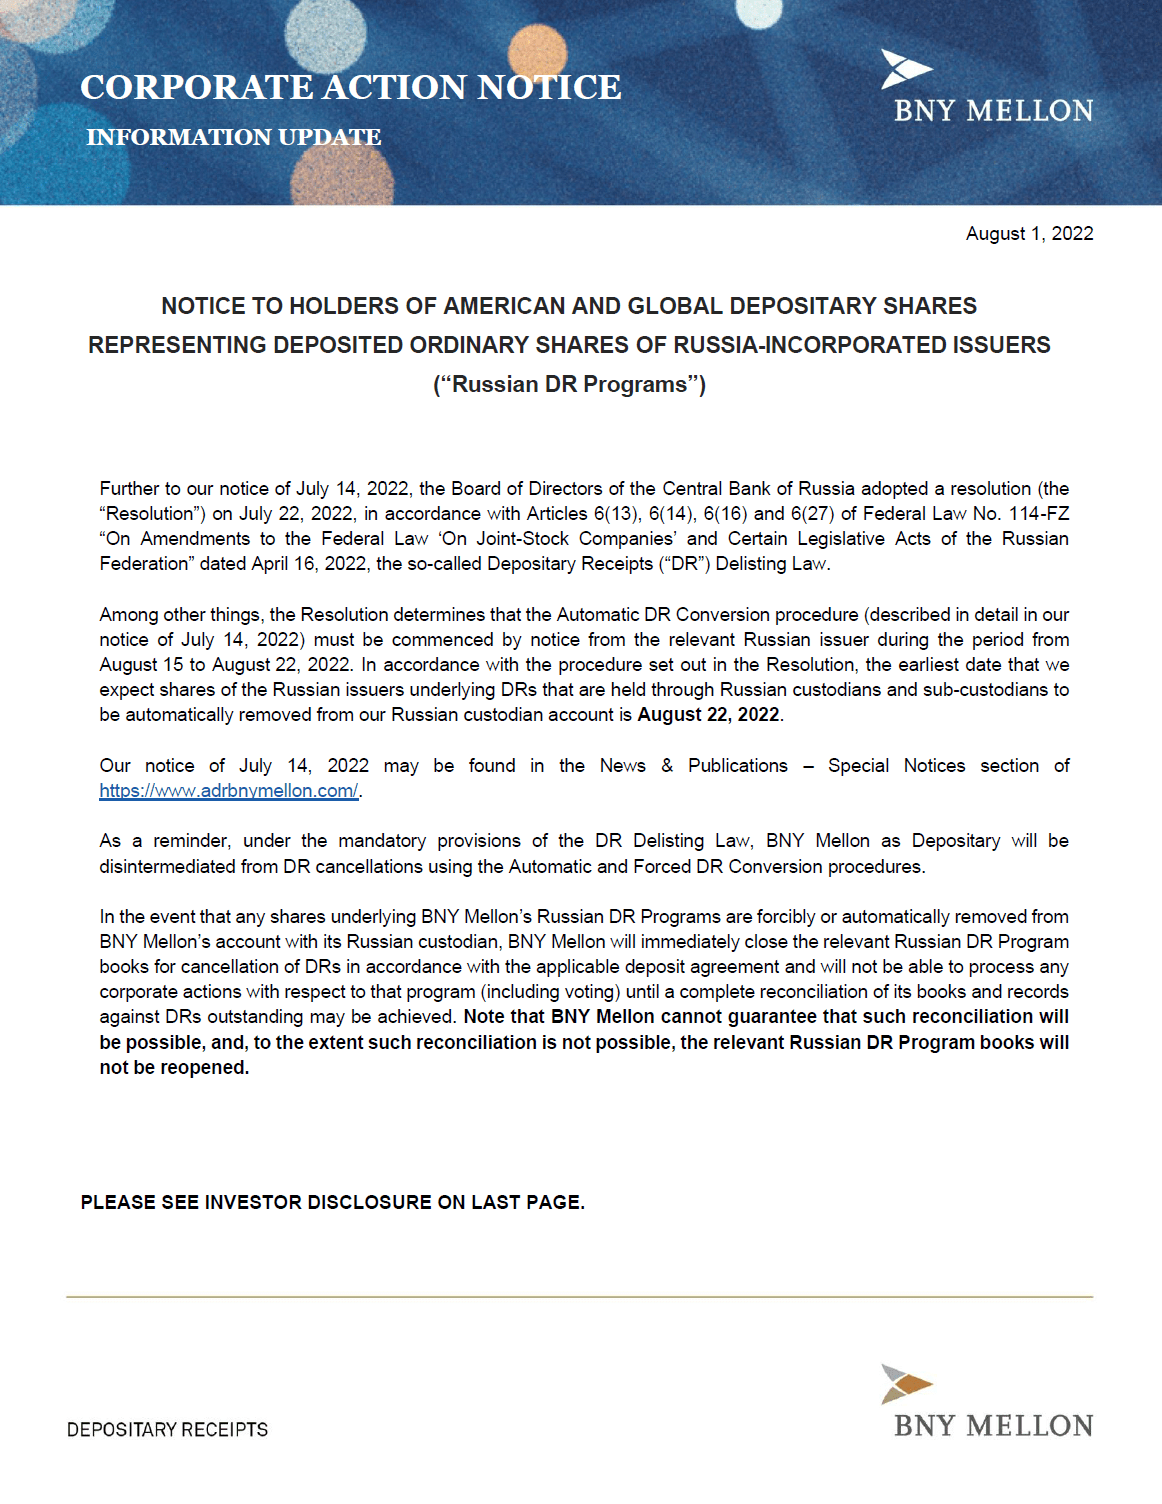
Source: Russia Update to DR Automatic Conversion, Aug 1, 2022, BNY Mellon
Earlier:
One of the strategies for building long-term wealth is to invest in stocks. While there are many markets to invest in for American investors, the US equity market has generated excellent returns in the past and continues to remain strong. In a recent post, I noted how US stocks as represented by the Dow have pounced other major developed markets from 2010 to 2021.
The more popular S&P Index has also performed very well over the years. Since 1926, the index has yielded positive returns 74% of the time as shown in the chart below.
Click to enlarge
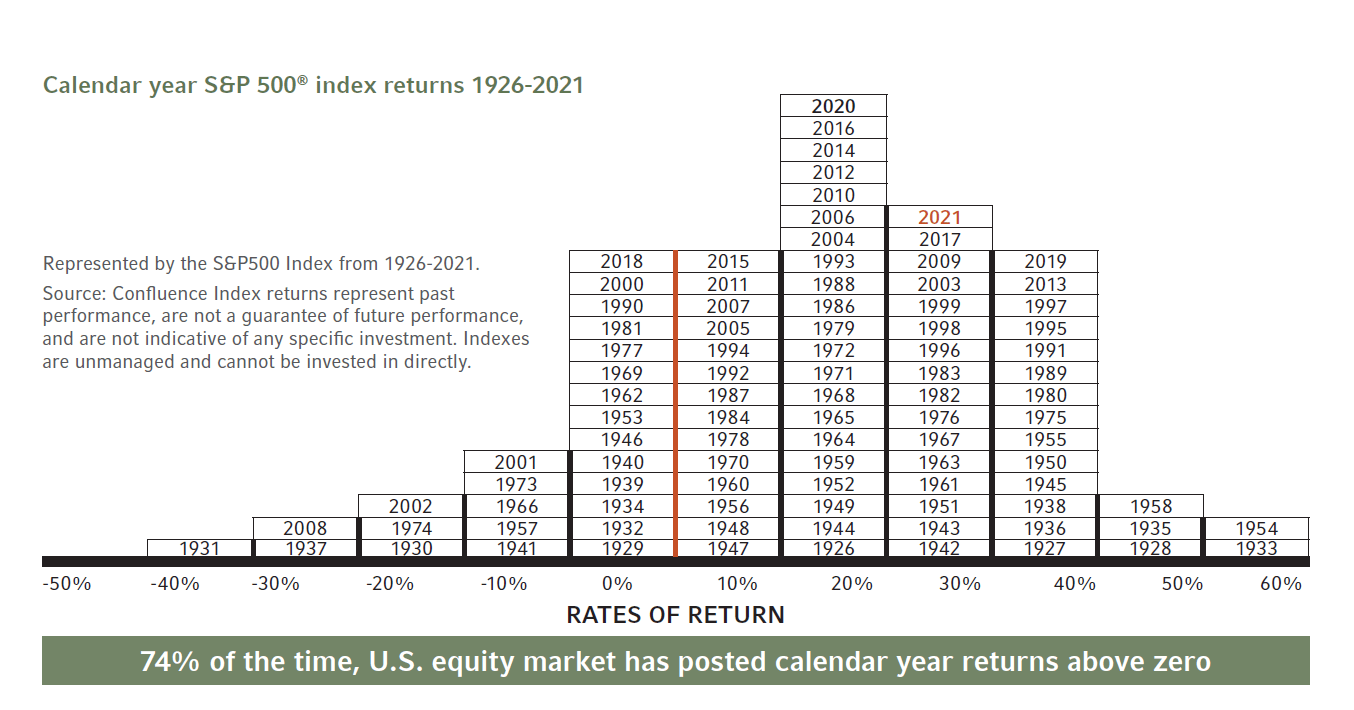
Source: Managing Market Volatility, Russell Investments
Related ETFs:
Disclosure: No positions
Similar to the S&P 500 Index, the FTSE All-Share Index for the UK equity market has also generated positive year-end returns in most of the recent few years though the intra-year declines was negative. The following chart shows the intra-year highest declines vs. year-end calendar returns for the FTSE All-Share Index from 1986 to 2022 year-to-date:
Click to enlarge
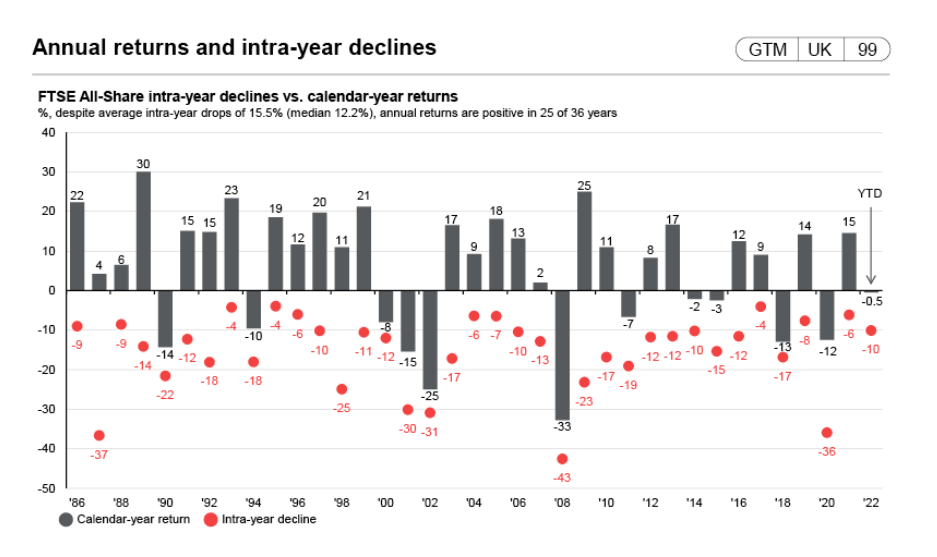
Source: The Bear Market issue, Permanent Wealth Partners
Note: The FTSE All-Share Index is comprised of the FTSE 100, FTSE 250 and the FTSE Small-Cap Index in the UK market
From the above-linked piece:
This grey bar shows the end-of-year returns for the FTSE All-Share, but the red dot and number show the scale of the largest intra-year decline from peak to trough. There are 8 years out of 36 where the intra-year decline has been greater than 20%, so just under 1 in 4. And many more at 17%, 18% or 19%.
The key takeaway is that volatility in the markets is a feature and not a bug. Markets never constantly go in one direction. When stocks decline as in the current bear market it is important to keep calm and not react by making rash decisions.
Related ETFs:
Disclosure: No positions